Commercial Payer Denial Rates by Specialty in 2024 and 2025
Denial rates now depend on specialty, payer mix, and algorithmic behavior.

Denial rates by specialty in 2024 and 2025 are pulling further apart from any single industry average, and that spread is the real story. A practice's denial rate now depends on three things at once: its specialty, its payer mix, and the specific algorithmic behavior of whichever insurers it bills most. Treating denial rate as one number to check against one industry benchmark means missing what's actually going wrong. This piece walks through where the data lands by payer type and specialty, why the reason code behind a denial matters more than the rate itself, and what's pushing the numbers up.
The initial denial rate across the industry has climbed year over year, and the share of providers reporting denial rates above what used to count as acceptable has grown a lot since 2022, according to Experian Health's State of Claims survey. Kodiak Solutions, drawing on a large multi-hospital and multi-physician dataset, found that commercial insurers were also paying slower in 2024 than in 2023. Put those two trends together and the damage compounds: claims take longer to pay, and more of them get denied along the way.
The dollar impact is worse than the denial count alone suggests. Net revenue lost to denials and bad debt jumped from 2024 to 2025 at a pace faster than denial volume growth would explain on its own, which points to rising resolution costs and more claims simply getting written off instead of fought. Outpatient claims tell a particularly ugly version of this. Outpatient denial rates run lower than inpatient in raw terms, but outpatient leakage runs higher, because the dollar value of a single outpatient claim often doesn't cover the labor cost of reworking it under a typical staffing model. The claim just dies in a queue somewhere, and nobody notices until the quarter closes.
Algorithmic adjudication, tightened authorization-matching logic, and clinical criteria that get updated with little or no notice have changed the structure of how payers process claims. A denial rate that felt fine two years ago may already sit below where the benchmark has moved; the floor changed, and most practices haven't noticed, because their internal targets haven't moved with it.
How denial rates differ by payer type — and why commercial and Medicare Advantage are the hardest fights
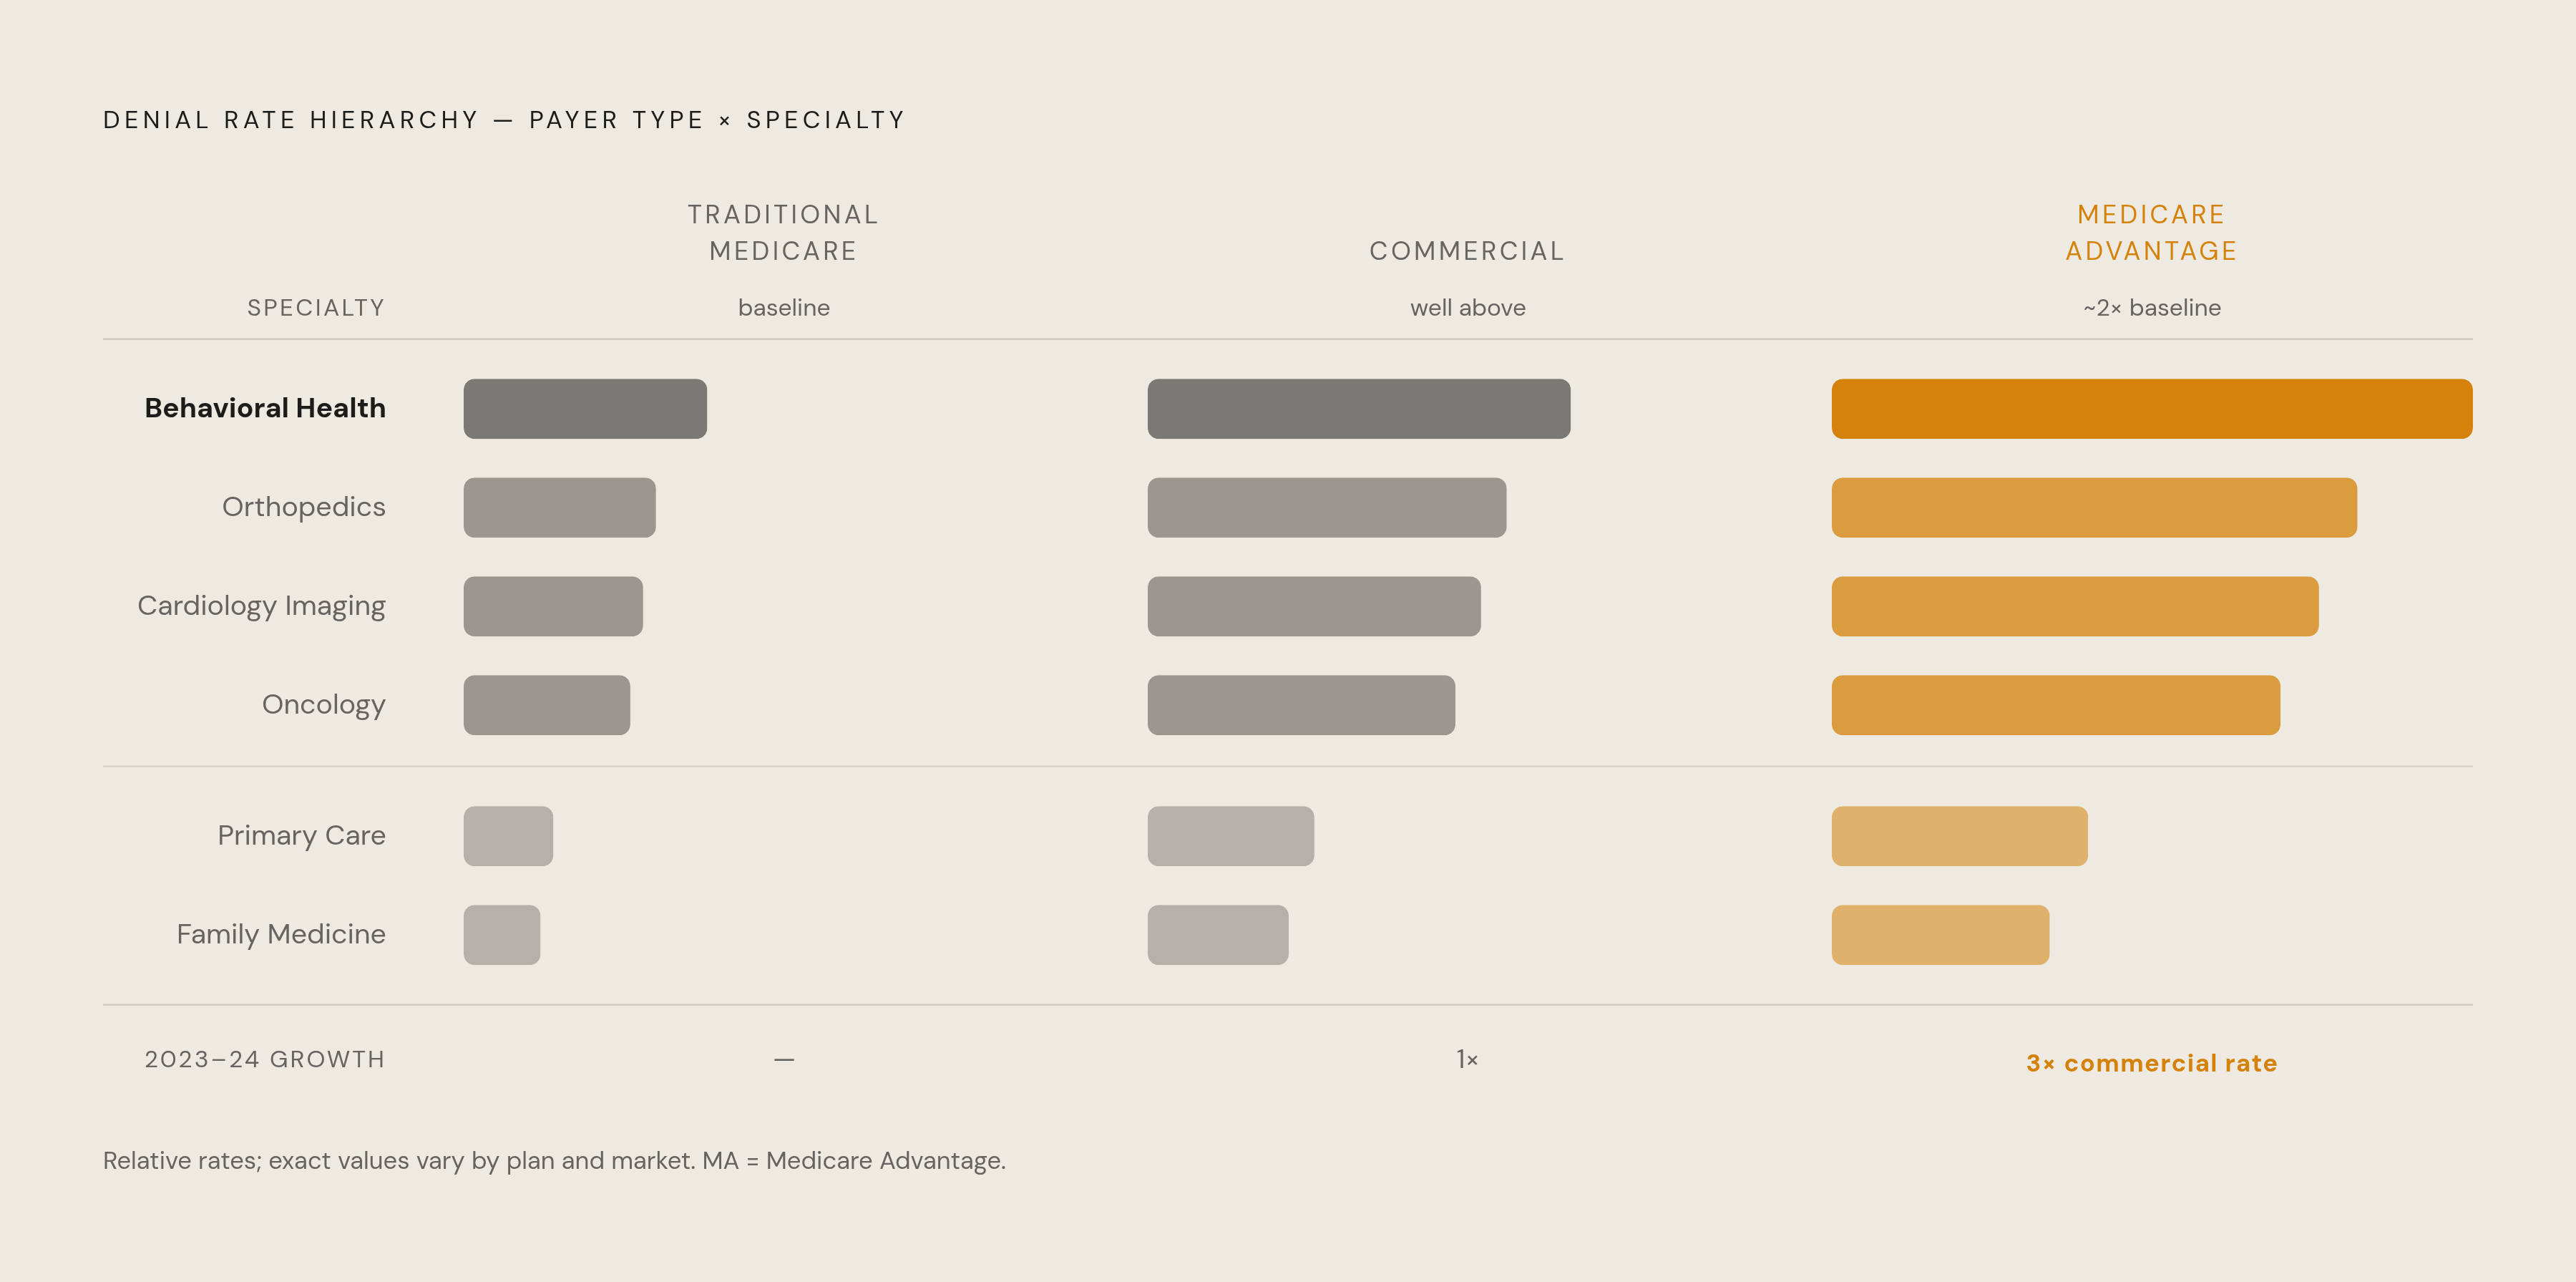
Traditional Medicare fee-for-service posts the lowest denial rate of any major payer category, which makes it the useful baseline against which everything else looks worse. Commercial payers cluster well above that baseline, with real spread between the most aggressive and least aggressive plans a given practice deals with.
Medicare Advantage is the outlier worth watching. MA denial rates have grown faster than commercial rates year over year and now run roughly double the traditional Medicare rate. The jump from 2023 to 2024 was nearly three times the rate of increase seen in commercial plans, an acceleration that outpaces anything else in the payer landscape. In MGMA's survey categories, UnitedHealthcare and Cigna sit at the high end among commercial payers, and the spread between the best and worst payer at a single practice can top eight percentage points. That's the difference between a functional AR cycle and a broken one.
There's a transparency gap buried in here too. MA plans have to publicly report denial rates. Commercial insurers face no equivalent requirement, so the commercial denial data that does exist, bad as it already looks, is probably an undercount, since it comes from voluntary survey response and self-reported figures rather than mandated disclosure.
This matters for how a practice reads its own numbers. Part of any practice's overall denial rate is just payer mix, not a reflection of billing quality. A practice heavy on MA patients will run hotter than one heavy on traditional Medicare, regardless of how clean its claims are.
The specialty denial rate map — where different practice types actually land
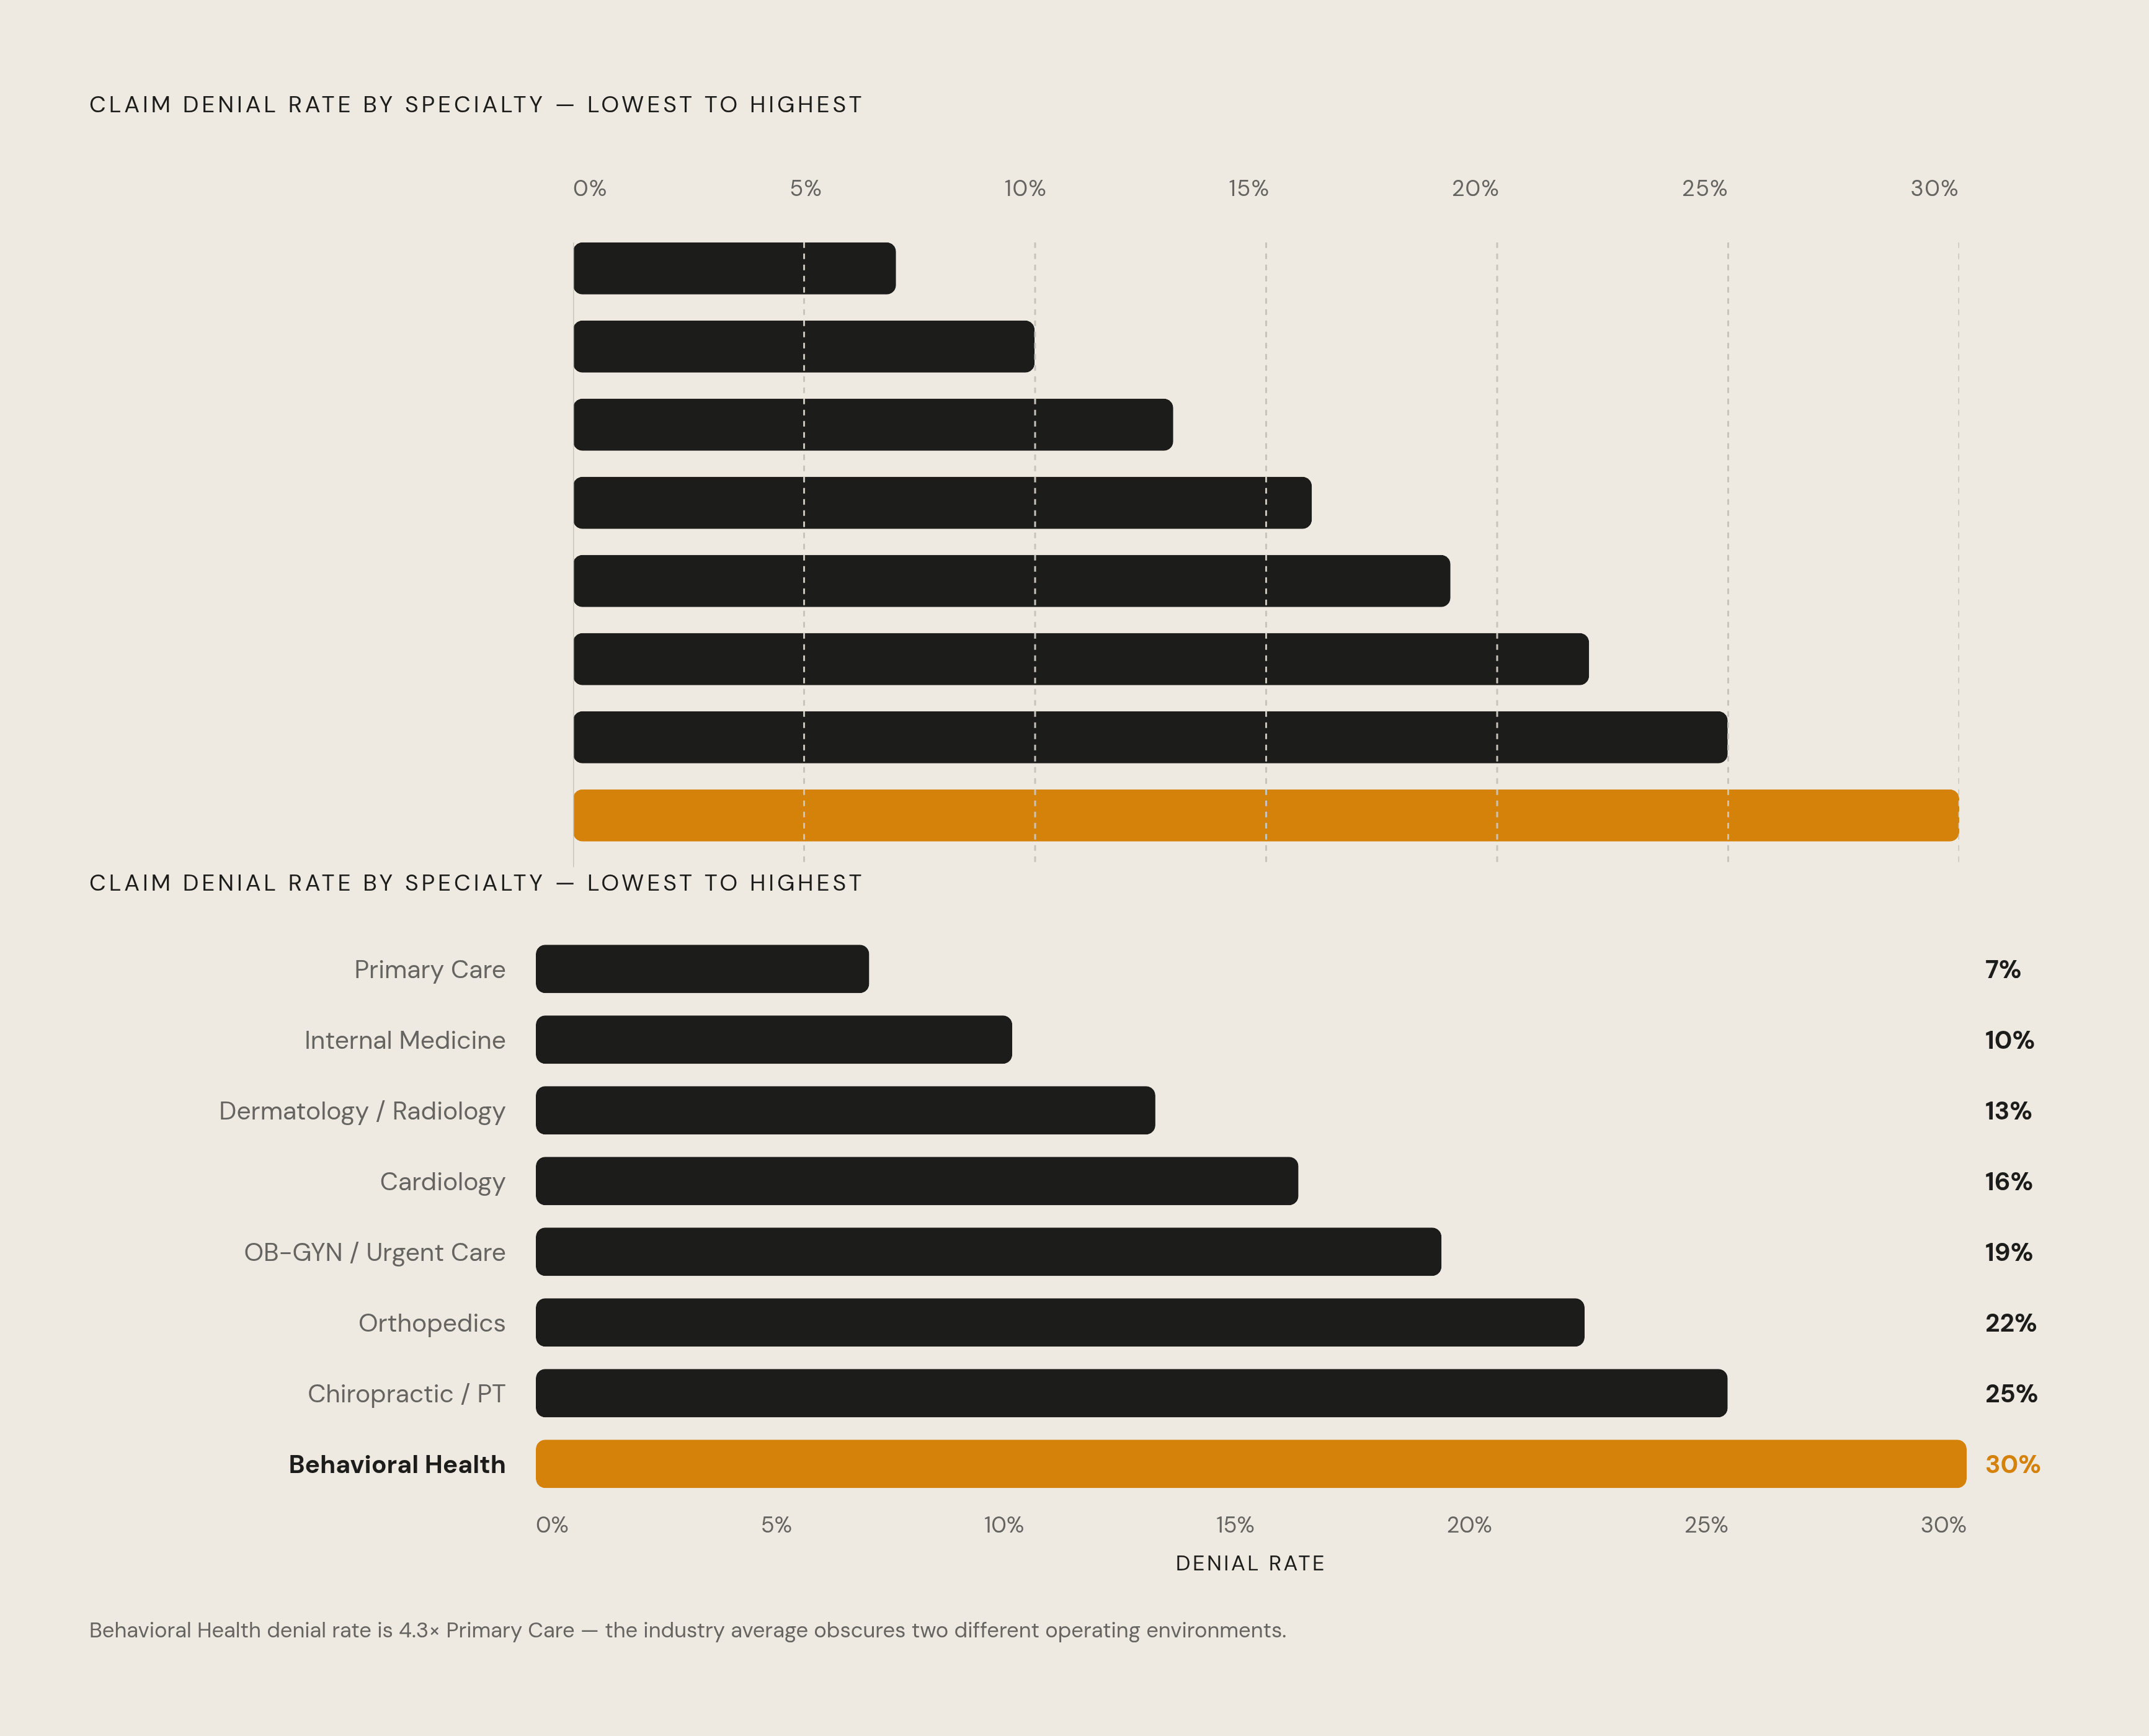
The gap between the lowest-denial specialties and the highest runs to more than double. That's two entirely different operating environments wearing the same metric.
Primary care and family medicine sit at the low end, thanks to straightforward E/M billing and light authorization burden. Internal medicine runs slightly hotter but stays in that lower tier. Dermatology and radiology land mid-range on commercial claims, though diagnostic imaging carries its own medical-necessity exposure that keeps it from behaving like a truly low-risk specialty.
The middle of the pack gets messier. OB-GYN sees elevated denial rates from global billing complexity and bundling disputes. Urgent care sits in the mid-range denial tier, with denial drivers that often surface before the claim ever reaches a payer. Cardiology sits mid-range overall, but that average hides real variance within the specialty: cardiac imaging and electrophysiology procedures pull denial rates well above the cardiology baseline on their own.
Then there's the high end, and it's not close. Orthopedics runs well above the industry average because prior authorization for surgical procedures, DME billing, and physical therapy authorization stack on top of each other. Mental health and behavioral health post the highest denial rate of any specialty, in both commercial and Medicare Advantage data, driven by carve-out plan complexity, parity-law disputes, and credentialing delays that have nothing to do with the clinical care delivered. ABA therapy runs at or above behavioral health rates. Chiropractic and physical therapy sit consistently among the highest-denial categories in the entire dataset. Oncology looks mid-range on raw denial rate, but denials are concentrated in high-value J-code drug claims and biologic step-therapy edits, meaning the dollar exposure per denied claim is serious. A moderate denial rate there still means serious dollar exposure.
Medicare Advantage denial rates follow a similar specialty rank order, with behavioral health posting the highest rate and primary care the lowest across both program types. Behavioral health posts the largest gap between MA and traditional Medicare of any specialty tracked. Rate alone still won't tell you what to fix, though. That takes knowing what's actually causing the denial.
Why the same denial rate means different things in different specialties — the claim type and reason code layer
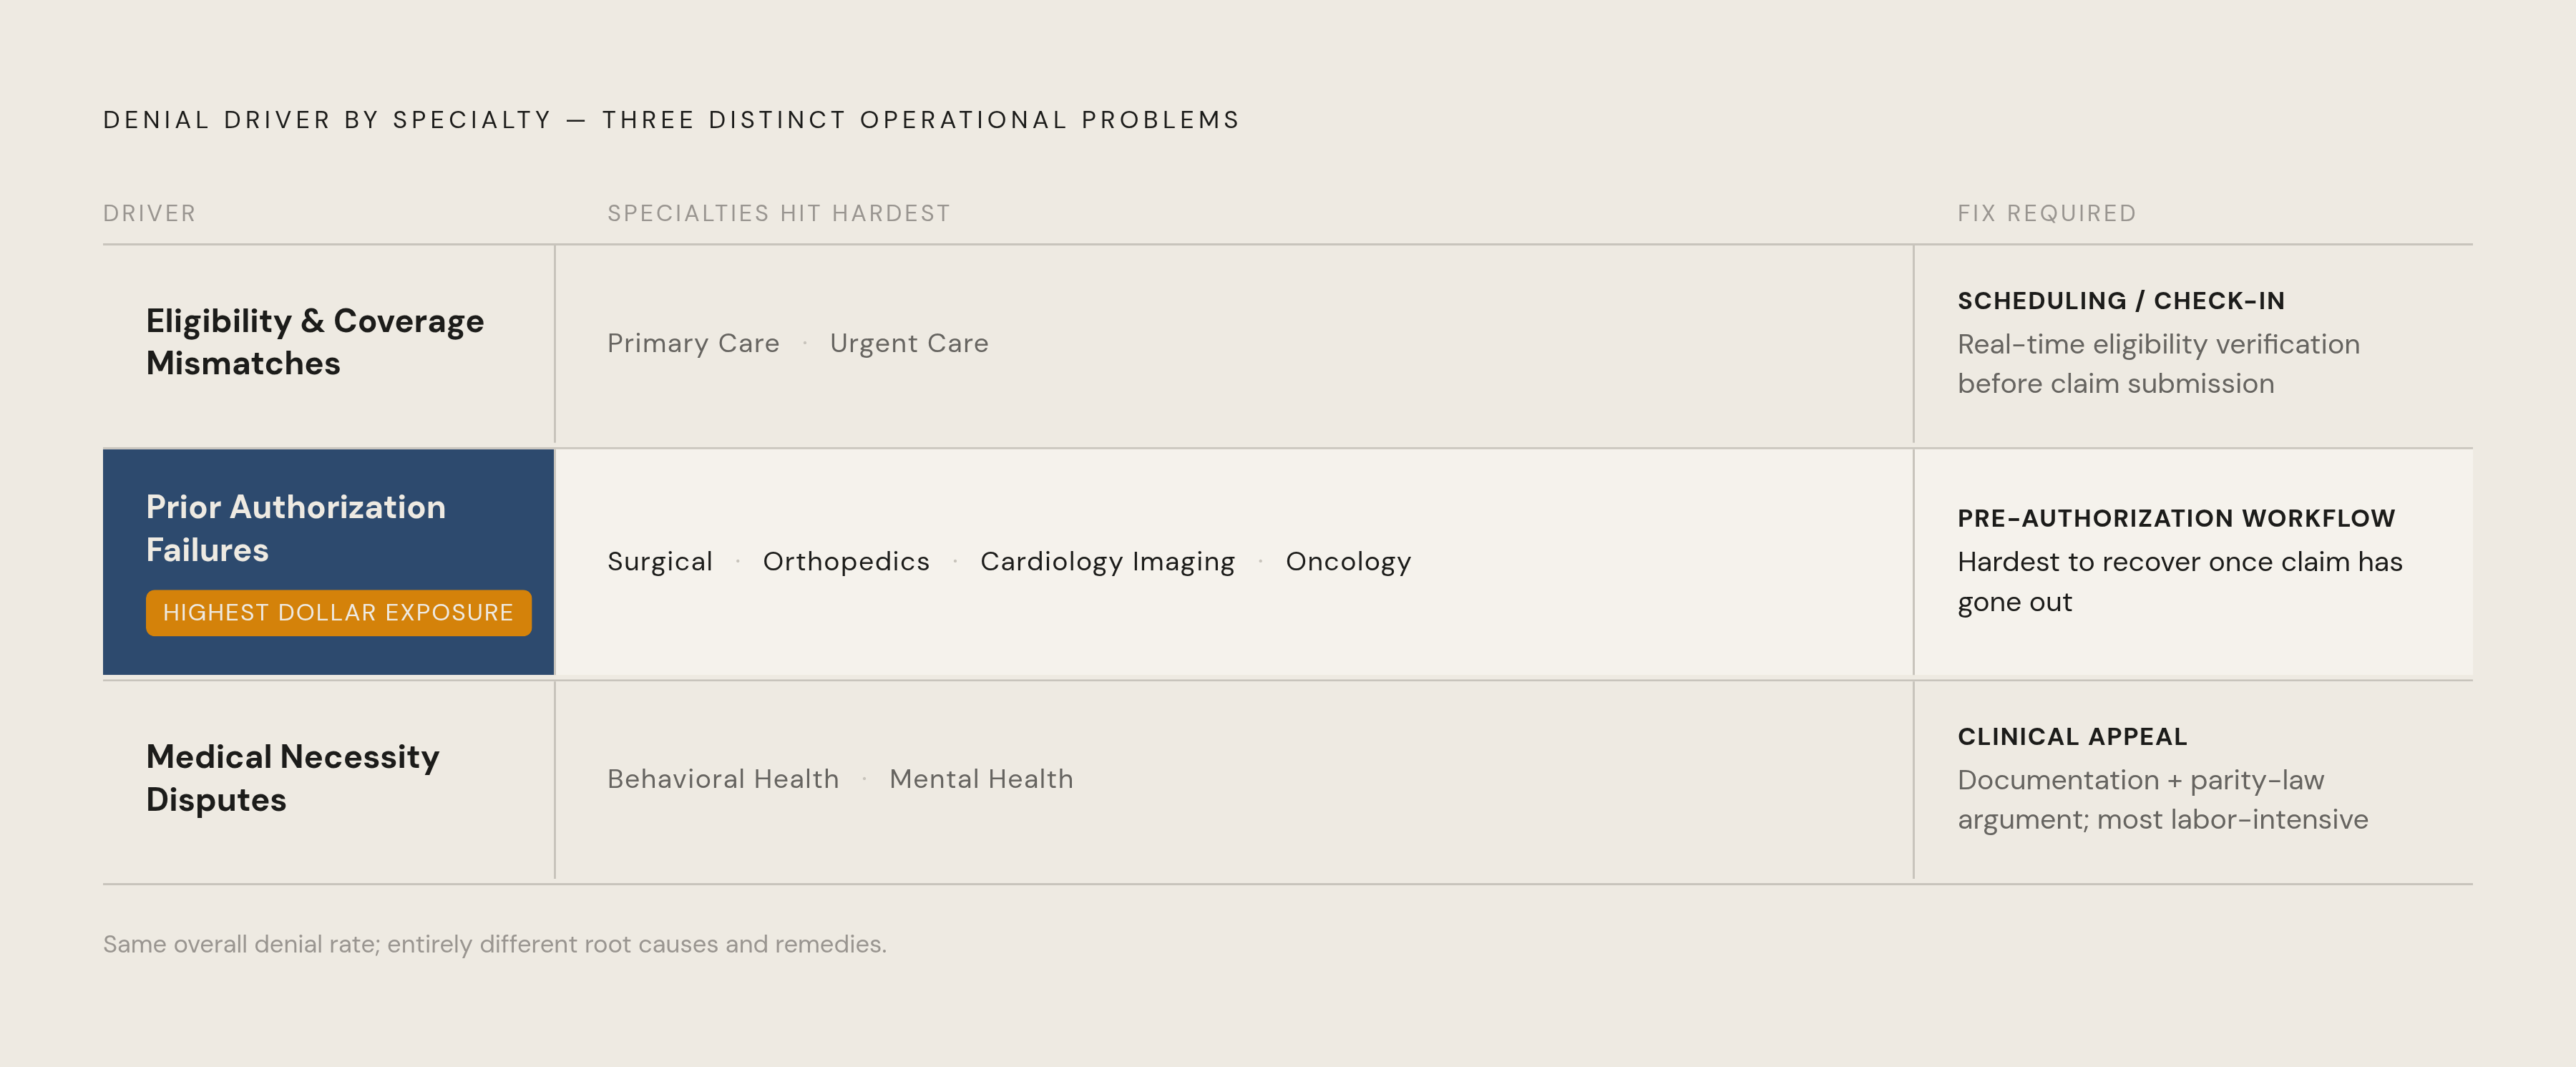
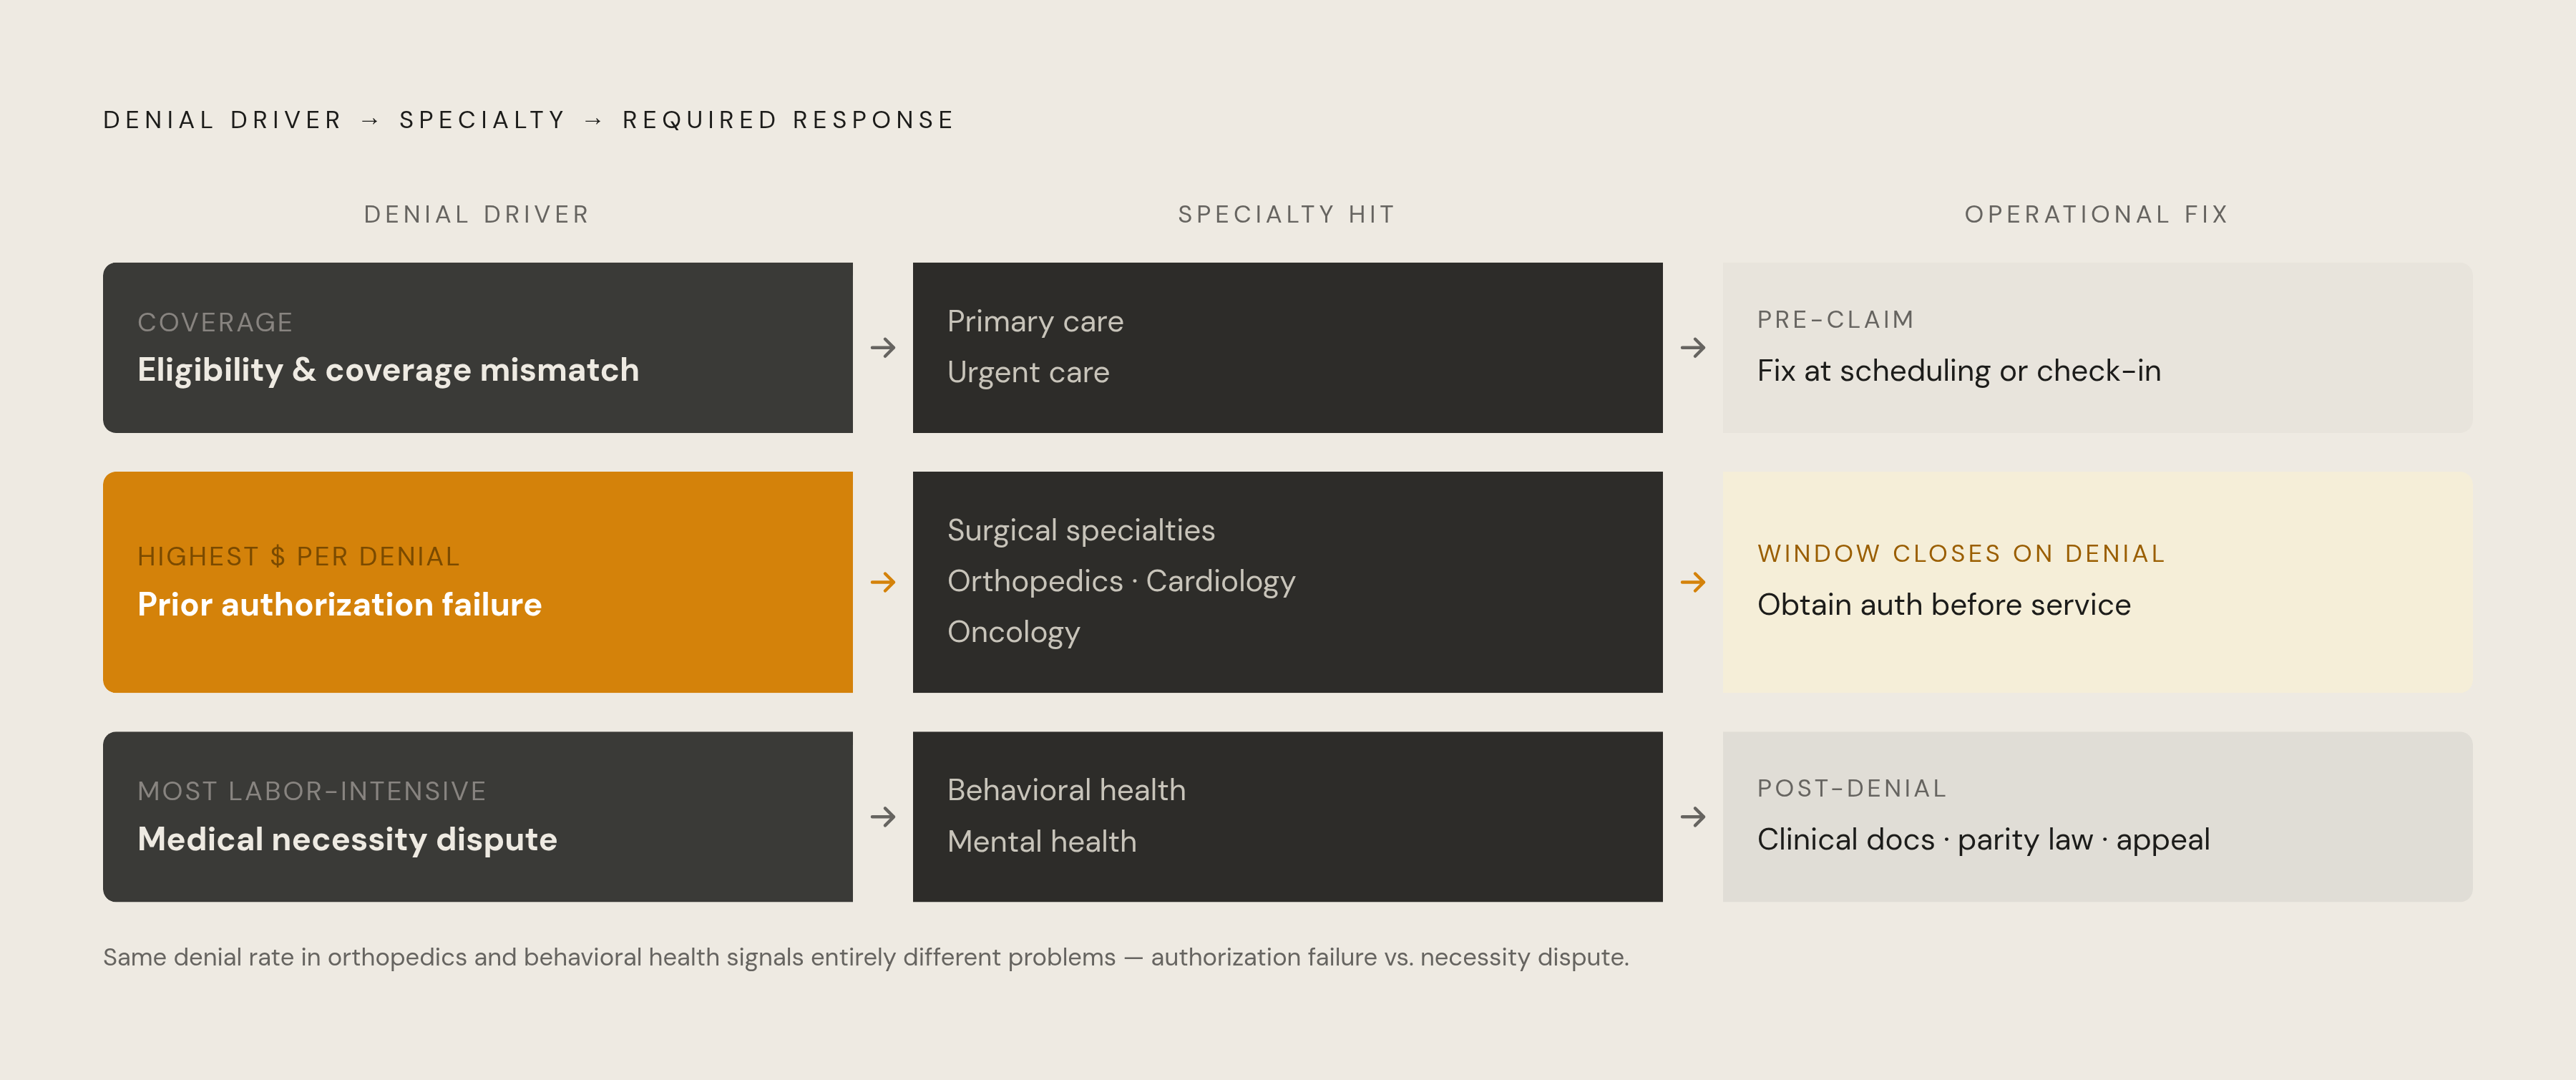
Three categories of denial driver dominate across specialties, and which one dominates changes everything about how a practice should respond.
Eligibility and coverage mismatches disproportionately hit primary care and urgent care. These are usually fixable at scheduling or check-in, before the claim ever reaches a payer, which makes them the cheapest category to solve if a practice actually builds the front-desk workflow to catch them. Prior authorization failures dominate in surgical specialties, orthopedics, cardiology imaging, oncology. These carry the highest dollar value per denial and are the hardest to recover once the claim has already gone out and come back denied, because the window to fix the authorization has usually closed. Medical necessity disputes dominate in behavioral health and mental health, and these require clinical documentation, parity-law argument, or a formal appeal. They're the most labor-intensive category to overturn, full stop.
A behavioral health practice and an orthopedic practice can post the exact same overall denial rate while facing two completely different operational problems that need two completely different fixes. That's the trap in treating denial rate as one comparable metric across specialty lines.
The 2024 Kodiak data shows medical necessity denials and information-request denials growing faster year over year than other categories, and both require active documentation work rather than a simple resubmission. Coding complexity adds another layer on top: specialties with high procedure-code specificity, orthopedics, radiology, oncology, generate more technical denials per claim than generalist specialties do, regardless of how the payer behaves. A practice that only tracks its aggregate denial rate, without breaking it down by denial type, can't tell whether it's got an eligibility problem, a prior auth problem, or a documentation problem. It ends up solving the wrong one, which burns staff time and doesn't move the number.
How specific payer behaviors in 2024–2025 are manufacturing denials that clinical quality cannot prevent
Some of the worst denial trends right now have little to do with how well a practice documents or codes. They come from specific, identifiable payer systems and policies.
UnitedHealthcare's post-acute denial rate rose from a modest baseline to an extremely high one between 2019 and 2022, coinciding with the deployment of the NaviHealth nH Predict algorithm. Plaintiffs in ongoing litigation allege that the overwhelming majority of appealed denials were ultimately reversed, which would mean the initial denial was wrong at a startlingly high rate. A Minnesota federal court ruled in February 2025 that breach of contract and good faith claims can proceed, and waived the exhaustion requirement as futile, a real procedural win for plaintiffs trying to hold the algorithm accountable in court.
Separately, UHC tightened its authorization-to-claim matching logic in 2025. NPI mismatches between group and individual billing, date-of-service range mismatches, and place-of-service mismatches now trigger automatic denial with no human review, as part of an AI adjudication upgrade. A multi-provider oncology practice can face substantial annual revenue exposure from these retroactive PA match denials alone. These are technical denials on services that were already clinically approved. The care was authorized, yet the claim gets denied anyway because a field didn't match.
Cigna faces its own version of this fight. The insurer has been accused of using an algorithm, known as PxDx, to deny claims in large batches without individual clinical review, based on preset criteria. A California federal court allowed the resulting class action to proceed in March 2025, finding that algorithmic batch decisions may violate plan terms. Cigna disputes the characterization of the process as AI-driven, but the operational effect on practices, high-volume denials issued without anyone looking at the individual claim, is the same regardless of what the company calls the mechanism.
Blue Cross Blue Shield plans working through AIM Specialty Health updated clinical criteria for musculoskeletal and spine procedures in the second quarter of 2025, adding stricter requirements around how long a patient must try conservative treatment first. Orthopedic practices that had been getting routine authorization under the 2024 criteria started seeing denials without changing anything about their clinical approach, because the policy shifted underneath them with no proactive notice. A mid-size orthopedic group's annual exposure from that single criteria change runs into the tens of thousands of dollars.
A Senate investigation accused major Medicare Advantage insurers of targeting post-acute denials specifically as a cost-reduction tool through AI systems. CMS responded in 2024 with guidance permitting AI use in prior authorization, so long as it complies with anti-discrimination standards, but declined to implement formal AI regulation for prior authorization in 2025. That leaves a real gap: payer algorithmic behavior is currently checked only by litigation, case by case, not by any proactive regulatory oversight. The pattern across all four of these payer situations is the same. Denials increasingly come out of systems that never touch the clinical record, and the appeal is the only correction mechanism available. Most practices don't use it enough to matter.
Prior authorization denial rates by specialty — the volume and revenue at stake
Prior authorization volume in Medicare Advantage has grown dramatically since 2019, into the tens of millions of requests a year, and the denial rate climbed right alongside it rather than settling as the system matured. Standard PA requests get denied at a meaningfully higher rate than expedited ones, a strange inversion: the process built for urgent cases is actually working slightly better than the routine one.
UnitedHealth Group denied the highest share of standard PA requests among the major MA insurers. Centene led on expedited request denials. And here's the part that should bother every practice leader reading this: most denied PA requests are never appealed at all, and among the ones that are appealed, a very high share get overturned. Most PA denials are surrendered revenue, given up simply because nobody followed up.
The specialty exposure varies. Orthopedic PA denial volume grew sharply between 2024 and 2026 as payers expanded authorization requirements into advanced imaging, outpatient surgical procedures, and DME, and a multi-provider orthopedic group's annual PA denial exposure can run into six figures. Oncology carries the highest per-claim denial values of any specialty; a single denied biologic or specialty injectable PA represents serious individual revenue risk, with step-therapy mandates as the primary mechanism forcing that denial. Cardiology carries meaningful annual PA exposure too, concentrated in cardiac imaging and electrophysiology.
Lawmakers have noticed. Thirty-one states passed laws limiting prior authorization in 2025, with broad bipartisan support, the most active legislative session on this issue the program has seen. CMS finalized a rule in 2024 requiring payers in its programs to speed up PA processes and publicly report metrics including denial rates and response times, though the commercial market largely sits outside that requirement. This isn't purely a billing issue anymore, either. Prior authorization volume and denial rates have drawn sustained attention from both policymakers and providers.y the AMA reported a serious adverse event tied directly to prior-authorization delays, which reframes PA denial as a patient safety concern that regulators are starting to take seriously, not just a revenue cycle headache.
The benchmarks a practice should actually measure against — and what the gaps cost
Start with first-pass denial rate. The industry average has moved above what used to be the acceptable band, and HFMA's top-quartile target now sits below that current industry average, meaning most practices are, by definition, operating below best-practice performance. HFMA's clean-claim target on first submission is a high bar that only the strongest billing operations actually hit; most practices fall short.
Days in AR breaks down by specialty in ways that mirror the denial complexity above. Primary care and family medicine practices should keep this under roughly five weeks if well managed. Internal medicine has a slightly longer acceptable window. Cardiology and orthopedics run longer windows too, reflecting claim complexity, though high-denial payer mixes push many practices past even those extended thresholds. Behavioral health and oncology have the longest acceptable windows of all, and not coincidentally, they're also the specialties where denial management complexity makes hitting "acceptable" hardest. HFMA flags AR aged over ninety days as a key indicator; keeping that bucket to a small fraction of total receivables marks top-quartile performance. Kodiak's 2024 data shows true AR days climbing meaningfully year over year, which means these benchmarks keep getting harder to hit even for practices that haven't changed a single thing about how they work.
Net collection rate tells a similar story. HFMA sets both a minimum acceptable threshold and an optimal range that top performers reach, and collection rates dropped industry-wide year over year, meaning a lot of practices have drifted below the floor, not just short of the ceiling.
What does operating below benchmark actually cost? MGMA puts the industry-wide loss from poor billing practices in the billions annually. Manual rework on a single denied claim carries a real cost in staff time, and that cost compounds fast across denial volume, especially in high-denial specialties. Most denied claims never get appealed at all, and that's really the core finding buried in all this data: most denial-related revenue loss comes from claims that practices simply stopped chasing, not from cases that were never winnable. MGMA pegs typical billing and RCM costs at around five percent of collections whether staffed in-house or outsourced, but a practice running a high denial rate pays that five percent and still loses the revenue tied up in unresolved denials on top of it. That's paying twice. Services like Altair Health, an AI-powered medical billing operation for independent and small-to-mid-size physician practices backed by in-house expert billers who work the denials the AI surfaces, exist specifically to close that gap without requiring practices to hire and hold billing staff through turnover cycles.
MGMA's 2024 poll found that most medical group leaders reported higher claim denial rates than the year before, while only a small fraction saw any improvement. Benchmarks that looked entirely achievable in 2022 now take active, sustained work just to maintain, let alone beat.
What a practice needs to act on this data
None of this data does anything sitting in a report. A practice leader has to stop measuring one aggregate denial rate and start segmenting by denial reason code. An eligibility problem, a prior auth problem, and a documentation problem need entirely different fixes and, often, entirely different staff to make them.
Payer mix deserves an honest look too. A practice heavy on UnitedHealthcare or Cigna commercial plans, or heavy on Medicare Advantage generally, should expect to run hotter than the specialty-wide average, and should benchmark against peers with a similar payer mix rather than against the industry as a whole.
Appeal rate needs to become a tracked metric on its own, separate from denial rate. Given how many denied PA requests never get appealed, and how often the ones that are appealed get overturned, the gap between denial rate and appeal rate is where a meaningful share of recoverable revenue sits right now, untouched.
Practices in orthopedics, cardiology imaging, and oncology need a way to catch payer policy changes before they hit as denials, not after. The AIM Specialty Health criteria update and the UHC matching logic tightening both landed with no advance notice to the practices affected, and there's no reason to assume the next one will be different.
Last, this data should shape staffing and workflow investment specifically, not generic technology purchases. A behavioral health practice needs documentation and appeals capacity. An orthopedic practice needs prior authorization tracking that catches payer criteria drift in real time. A primary care practice mostly needs a tighter front-desk eligibility check. The specialty determines the fix; the denial rate alone never will.