Denial Overturn Rates by Payer and Appeal Level
Most denied claims get overturned on appeal, if providers fight them.

Denial overturn rates prove a hard truth about medical billing: most claims that get denied were never wrong to begin with. The data on appeals, from internal reconsideration through independent external review, shows that the majority of denials fall apart under scrutiny. The practices that recover the most money are not the ones with the fewest denials. They're the ones that know which denials to fight, at which stage, and how to build the file that wins.
The scale of the problem sets the stakes. The Experian State of Claims Report put the industry-wide initial denial rate at 11.8% in 2024, up from 10.15% in 2020 (a figure from Kodiak RCA/Crowe healthcare consulting, a separate dataset). Change Healthcare figures cited across industry reporting put 2025 projections somewhere between 12% and 15%, with 2026 landing near 12.6%, which works out to roughly 806 million denied claims a year and about $262 billion in claims denied on first pass. Industry data show that 65% of denied claims never get resubmitted or appealed. On the ACA marketplace side, KFF found in 2024 that fewer than 1% of in-network denials get appealed by patients. The burden of fighting back sits almost entirely on the provider's billing office. The system rewards persistence. Most practices aren't persistent enough.
What the appeal levels are and what happens at each stage
Every payer runs some version of the same three-step ladder. First comes internal reconsideration, sometimes called a first-level appeal, where the payer that denied the claim reviews its own decision. If that fails, most plans offer a second internal appeal, still handled by the same insurer. Only after both internal rounds are exhausted does a claim reach external review, conducted by an independent review organization (IRO) staffed by board-certified physicians and specialists with no relationship to the payer that issued the denial.
That distinction matters more than it sounds. The first two rounds ask an insurer to reconsider its own judgment. The third round hands the case to someone with no financial stake in the outcome.
A JAMA study covering New York state, run by researchers at Brown University, the University of Texas at San Antonio, and the University of Chicago, looked at 51,394 closed external appeal cases filed between May 31, 2019, and December 10, 2025. What stands out in that dataset is the documentation burden: by the time a case reaches the IRO stage, it often carries multiple letters from physicians, caregivers, and patients themselves, stacked on top of whatever the practice submitted at the internal stages. Fewer cases survive to reach that point, since the funnel narrows at each stage, and that narrowing is why aggregate overturn numbers can mislead a billing office. A blended rate across all three stages tells you less than the trajectory across the three stages does, and the trajectory climbs.
One more structural gap deserves mention. Payers frequently do not disclose specific denial reasons in ways that give billing staff a clear map of what was actually objected to. That gap resurfaces later, because it shapes how targeted an appeal can be.
What overturn rates at the internal appeal level tell practices
The headline number from Premier Inc. data is this: 70% of denied claims that providers actually bother to appeal get overturned at the internal level. That figure alone should reframe how a billing office thinks about denials. Most of them aren't dead ends. They're paperwork failures waiting on someone to correct the record.
Prior authorization denials show an even sharper pattern. AMA-sourced data puts the overturn rate for appealed PA denials at 82%, and yet fewer than 11% of patients with a PA denial ever file an appeal. Running the arithmetic on those two numbers together makes the conclusion inescapable: an enormous volume of valid, payable claims simply gets abandoned because nobody submitted the paperwork to fight them.
The 70% aggregate hides real dispersion, though. Overturn rates swing by payer and by denial type, so a billing office treating every denial the same way, appeal everything or appeal nothing, is leaving money on the table either direction. And a high internal overturn rate is proof the initial denial was frequently wrong in the first place, not evidence the appeals system is fair. It's proof the initial denial was frequently wrong in the first place, a point the JAMA researchers make directly when they describe upstream utilization review as not functioning as intended. That framing matters for what comes next: if internal appeals already overturn most of what gets challenged, the question becomes whether it's worth pushing further when internal appeals fail. The data says yes, emphatically.
What happens to overturn rates when a denial reaches independent review
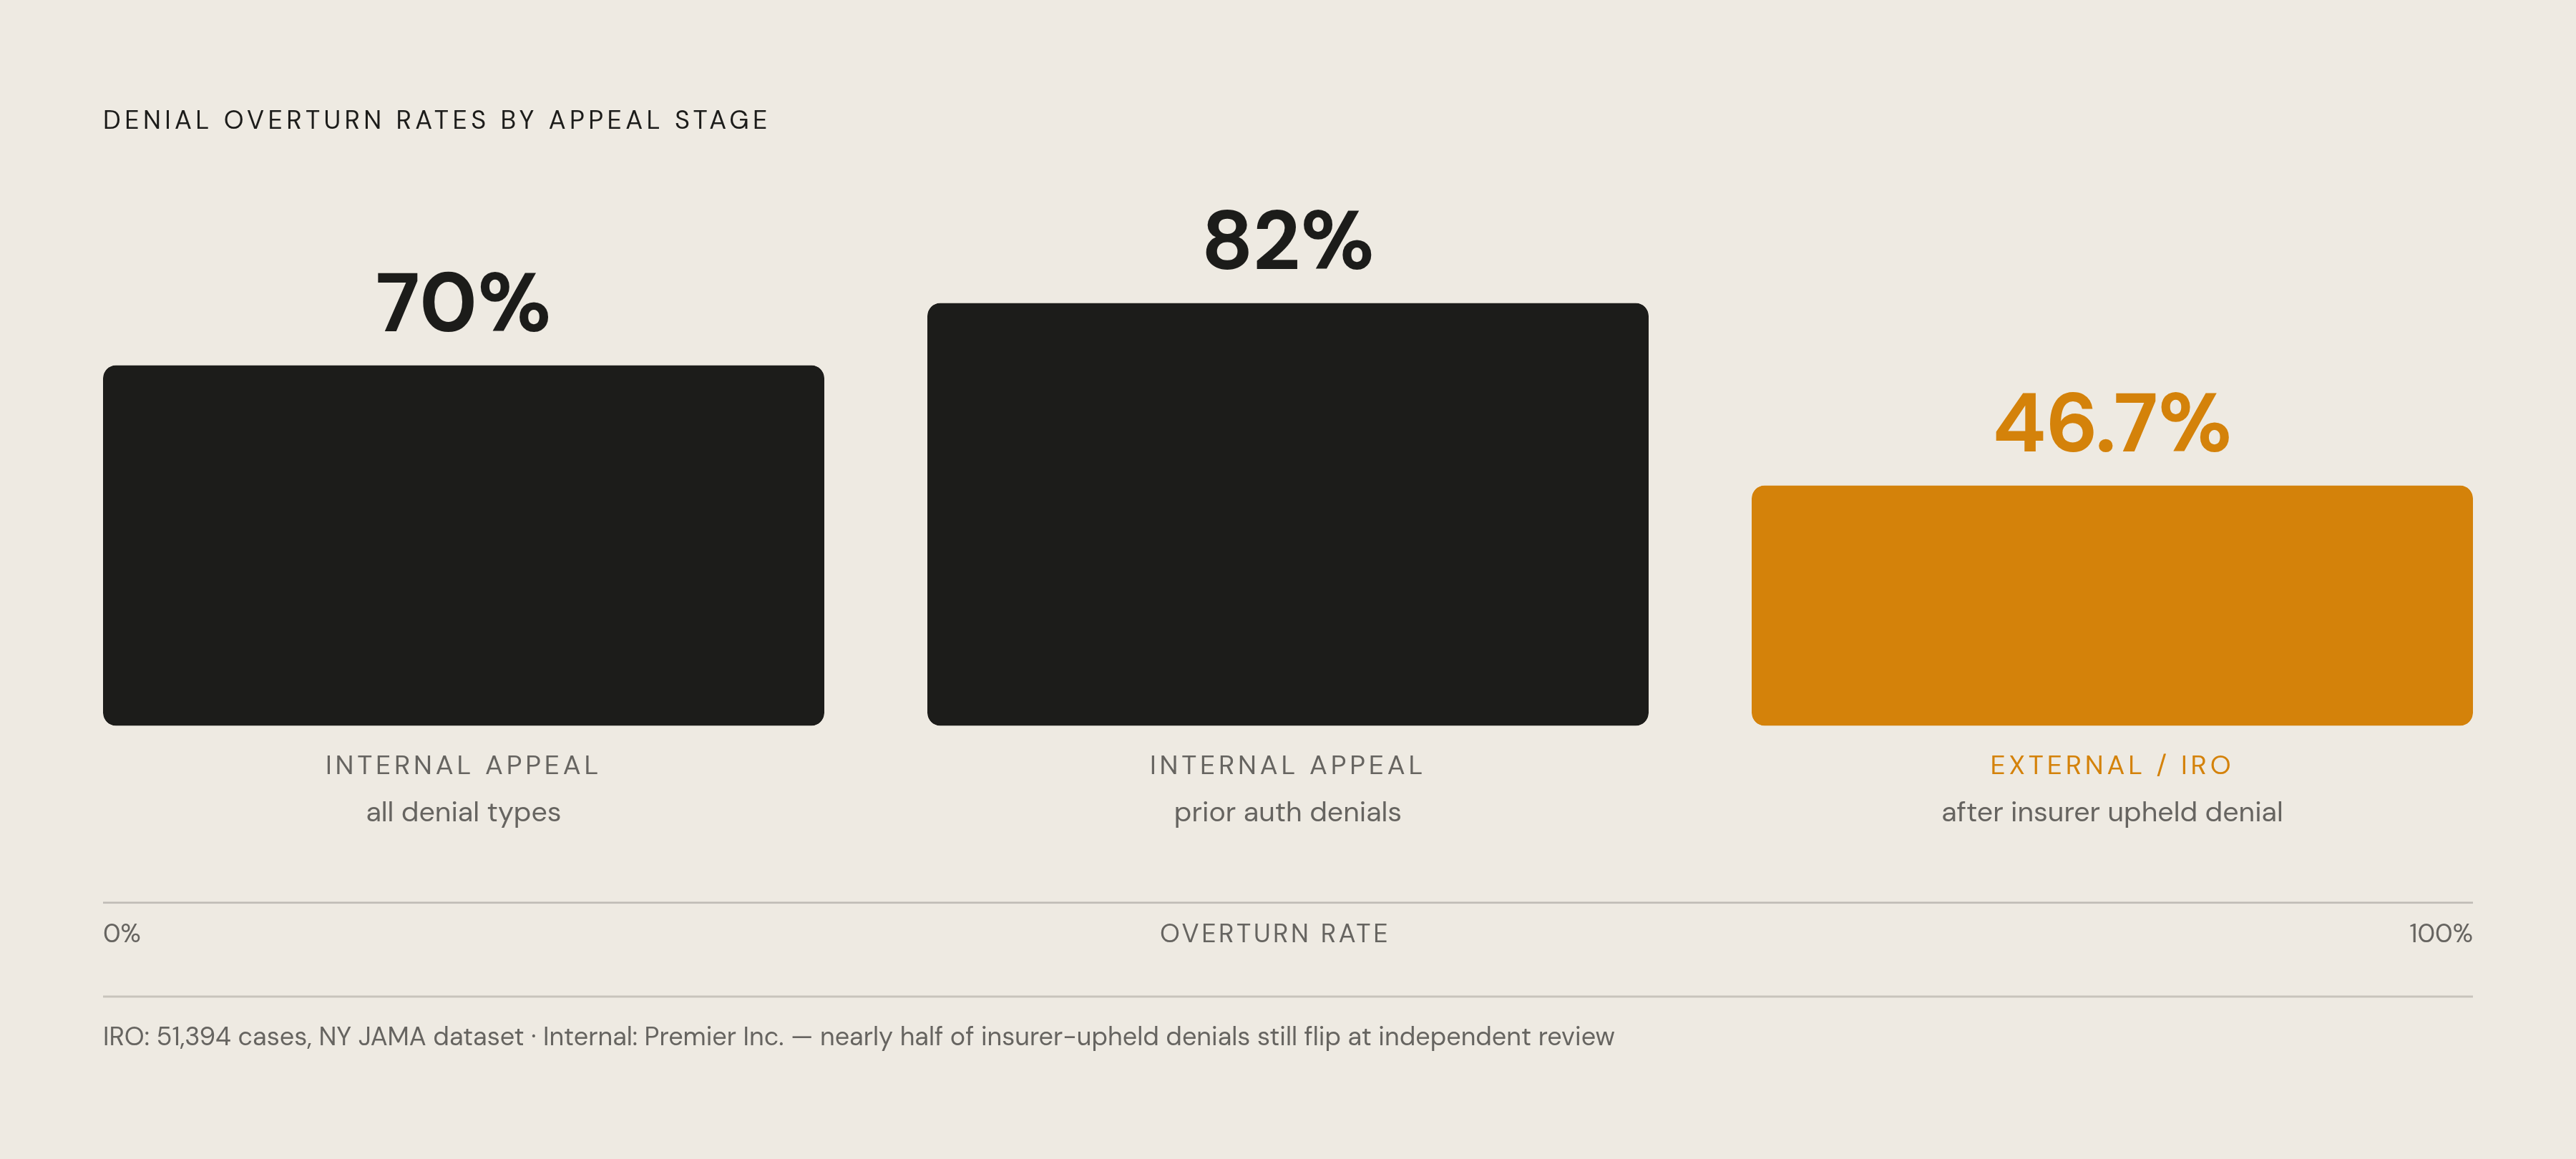
The New York JAMA dataset answers that question with a number that should reshape how practices think about escalation: 46.7% of external appeals got overturned at the IRO stage, nearly half, even after the insurer's own internal review had already upheld the original denial.
That average masks a wide spread. The same analysis reported through ACDIS found IRO overturn rates ranging from 30% to 78% depending on the service category and the insurer involved. Home healthcare denials overturned at 78.4%, the highest of any category studied. Surgical services, dental and orthodontic care, and pharmacy or prescription drug denials each overturned more than half the time. Broken out by diagnosis, substance abuse treatment denials overturned 61% of the time, mental health services 60.6%, central nervous system and neuromuscular disorder claims 53.1%, and cancer-related denials 45.1%.
Named insurers showed just as much variance. In the New York data, Centers Plan for Healthy Living had an 85% IRO overturn rate. Aetna sat at 51.1%, Excellus at 50%, CVS Caremark at 49.8%, Fidelis Care at 48.3%, Anthem Blue Cross Blue Shield at 43.1%, and Metroplus Health Plan around 36%. A denial from one payer and a denial from another, even for a similar service, carry very different odds once they reach external review.
The trend line should worry payers more than providers. The JAMA study found that New York's overall IRO overturn rate climbed from 38% in 2019 to almost 53% in 2025. Overturn rates going up over six years is a sign that initial denial decisions are getting less defensible, not more, over time. It's a sign that initial denial decisions are getting less defensible, not more, over time. The study's authors wrote that rising case volumes paired with rising overturn percentages "signal that upstream oversight may not be functioning as intended."" Their recommendation followed directly from that finding, urging patients and clinicians to "consider pursuing external appeals given the high overturn percentage." For a billing office, the implication is operational: stopping at the internal appeal stage leaves a huge share of recoverable revenue sitting on the table, and a practice that treats IRO escalation as a rare last resort is running the math backward.
How overturn rates differ by payer across Medicare Advantage, Medicaid, and ACA plans
The clearest comparative picture of payer behavior comes from a KFF analysis of the first public disclosures under CMS-0057-F, covering multiple insurers across tens of millions of enrollees, with reports due March 31, 2026. Nothing else in the current data covers this many payers side by side.
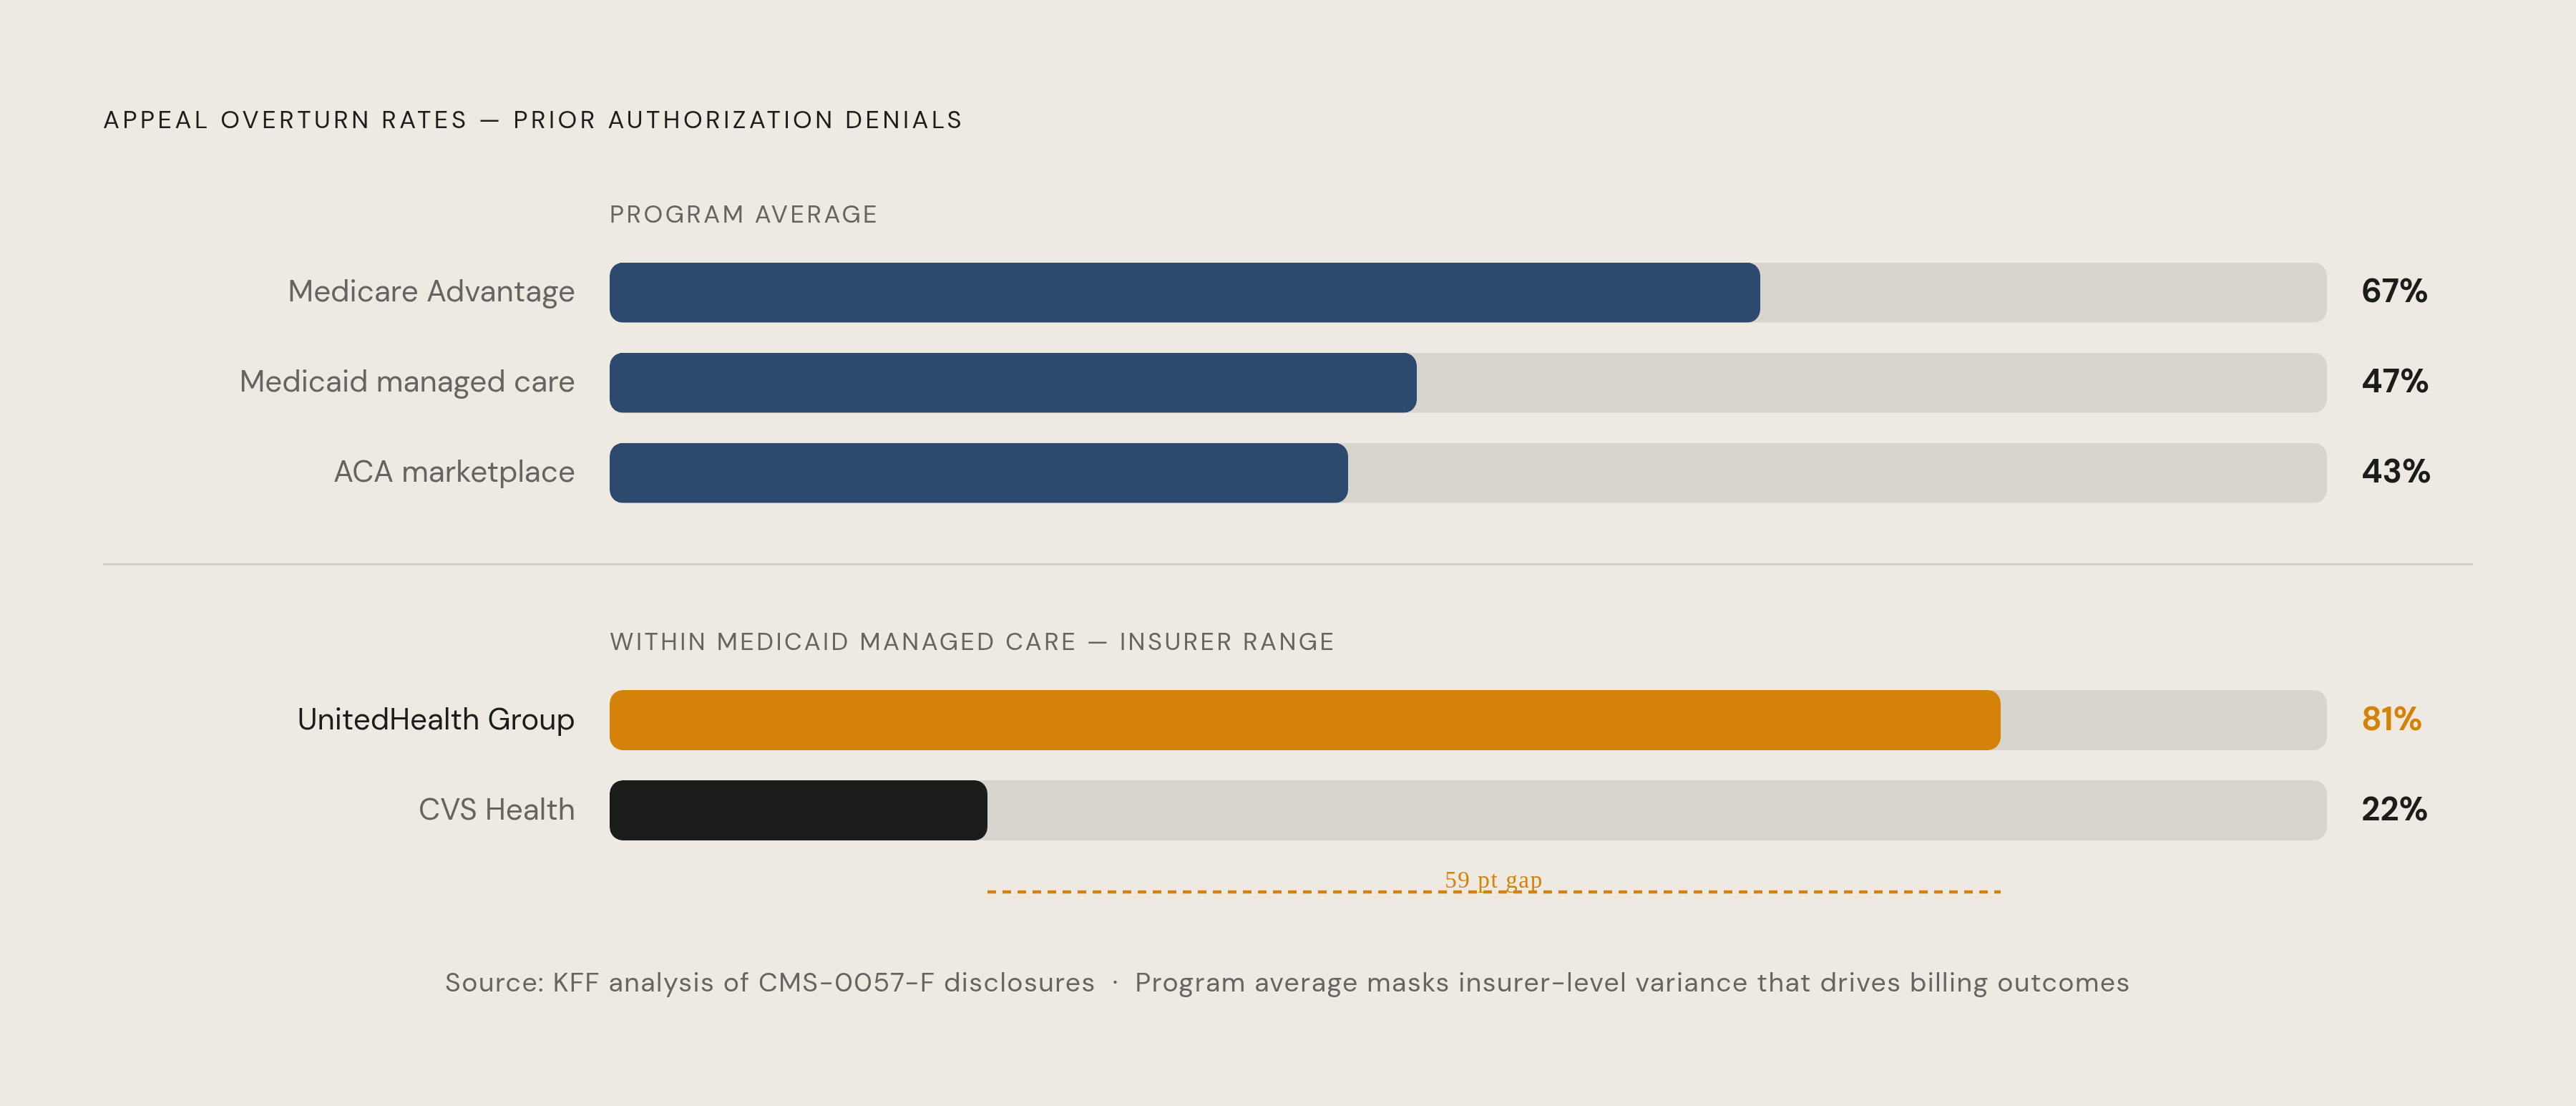
The KFF analysis cited by distilinfo.com put program-wide appeal overturn rates for prior authorization denials at 67% for Medicare Advantage, 47% for Medicaid managed care, and 43% for ACA marketplace plans. Those program averages, though, hide the kind of insurer-level spread that actually matters for a billing decision.
Inside Medicare Advantage, overturn rates varied dramatically by insurer, with some payers seeing the vast majority of their PA denials reversed on appeal and others sitting far lower, wide gaps within a single federal program. Medicaid managed care told a similar story: UnitedHealth Group's denials overturned 81% of the time, the highest in that category, while CVS sat at just 22%, the lowest. On the ACA marketplace side, payer-level overturn rates showed similar dispersion, with the highest-performing insurer reversing more than half of appealed denials and the lowest well below that.
Denial rates themselves varied just as widely. Among Medicare Advantage insurers in calendar year 2025 CMS-0057-F data, UnitedHealth Group denied prior authorization requests at a 17% rate, Centene at 15%, Kaiser Permanente at 13%, CVS at 8%, and Humana at 6.17%. Centene's combination of a 15% denial rate and a 93% overturn rate is about as strong a signal as this dataset produces: a payer denying that often, only to be reversed that consistently, is issuing denials that were rarely defensible in the first place. Zoomed out, 67% of appealed MA prior authorization denials overturn according to KFF analysis, and 57% of all denied Medicare Advantage claims eventually get overturned on appeal, PA-specific or not.
ACA marketplace denial rates, drawn from plan year 2024 CMS transparency data, ranged from Oscar Health at 25.3% and Molina Healthcare at 22%, down to Kaiser Permanente at roughly 6%. UnitedHealthcare cut its own rate from 34.2% to 19.1%, a 15-point drop, while processing 6.4 million claims. That's nearly a 20-point gap between the highest and lowest national insurers in the same market.
What should a billing office take from all this? A payer running a high denial rate alongside a high overturn rate, Centene in the MA data, is a payer whose denials are worth fighting almost automatically. A payer with a lower denial rate and a lower overturn rate calls for a more careful cost-benefit read before committing staff time to an appeal. No federal requirement currently forces commercial insurers to report denial rates the way CMS-0057-F now requires for MA, Medicaid, and ACA plans, so commercial payer-specific figures remain far harder to pin down.
Why prior authorization denials specifically are surging and why so many are inappropriate
Prior authorization denials jumped sharply year over year heading into 2026, and the requirements themselves have spread well beyond their old footprint, reaching into cardiology, orthopedics, pain management, and infusion therapy alongside the outpatient and specialty services where PA has long been standard.
The single biggest structural driver is automated review. Algorithms now process authorization requests in seconds, checking them against clinical criteria, but they routinely fail to distinguish a request that genuinely doesn't meet coverage criteria from one where the documentation simply doesn't match the keyword pattern the system expects. HFMA put it bluntly in 2025: "the AI arms race in healthcare billing is well underway, and right now the payers have the bigger system." A federal watchdog investigation found Medicare Advantage organizations denying prior authorization requests that actually met Medicare's own coverage criteria, which is cost containment tipping over into outright access restriction. Scale makes the problem worse: MA plans processed nearly 53 million prior authorization determinations in 2024 alone, so even a small error rate, run through automated systems at that volume, produces a large absolute number of bad denials. The 82% PA overturn rate is describing a system that gets the first call wrong at a systemic rate. It's describing a system that gets the first call wrong at a systemic rate.
CMS-0057-F was built to speed up prior authorization turnaround and force more transparency into the process, with key provisions compliance-effective January 1, 2026. In the near term, though, practices report denials rising rather than falling, since the rule's rollout created its own set of new compliance triggers that automated systems are still catching up on.
Some of the voluntary industry response looks promising, at least on paper. AHIP reported member plans eliminating roughly 6.5 million prior authorizations for patients. UnitedHealthcare announced it would drop most medical prior authorizations for roughly 1,500 rural hospitals and their affiliated rural practitioners, with set to take effect in fall 2026. Humana committed to cutting about a third of its outpatient PA requirements by January 2026. Whether these commitments actually move the aggregate denial rate down remains to be seen.
Gold carding programs offer a more durable structural fix. Several states had gold carding laws in place as of 2026, exempting providers with strong track records from routine prior authorization. Texas strengthened its version through HB 3812, effective September 1, 2025, extending the evaluation window from six months to a full year of PA history. UnitedHealthcare's own Gold Card program grew eligible provider groups by more than 40% in 2025. None of that changes the core conclusion, though: a high overturn rate is evidence the initial denial process doesn't work well, and that's exactly the reading policymakers and researchers have taken from the JAMA findings. It's evidence the initial denial process doesn't, and that's exactly the reading policymakers and researchers have taken from the JAMA findings.
What the data implies about where practices are losing recoverable revenue
The single biggest source of lost revenue isn't a bad appeal outcome. MGMA and AHA data show that 65% of denied claims never get resubmitted or appealed at all, the majority walking out the door unchallenged. That's not a rounding error. That's the majority of denied claims walking out the door unchallenged.
The cost compounds beyond any one claim. Every denial a billing office doesn't recognize as appealable is also a signal the practice is missing about every similar claim sitting in the queue behind it, and that institutional blind spot grows the longer it goes unaddressed.
Two questions ought to sit at the center of every denial review. First, which payer issued the denial, and what does that payer's track record say about the odds of a successful appeal? Second, what stage is the claim at, and how much better do the odds get if it's pushed to IRO review rather than left to die at the internal level? Service-type patterns matter here too. Home healthcare and surgical services overturn at IRO more than half the time, so practices with heavy volume in those categories should treat external review as the default plan, not the fallback.
Medicare Advantage panels deserve special attention given the 80.7% overturn rate on appealed MA prior authorization denials. A practice sitting on a stack of denied MA PA claims without a systematic appeal process is giving up the majority of a pool of money that was, statistically, always meant to be paid. CAQH and MGMA data show that reworking a denied claim carries a real cost, ranging from modest to fairly significant depending on the payer and complexity, but with overturn rates running 67% to 82% across MA and PA categories, the math favors appealing in almost every case that clears a basic sanity check.
The asset that actually compounds here is institutional memory, knowing which payers overturn most often, which service categories succeed at which appeal stage, and what documentation patterns actually move an IRO reviewer. It's institutional memory, knowing which payers overturn most often, which service categories succeed at which appeal stage, and what documentation patterns actually move an IRO reviewer. That kind of knowledge builds slowly and evaporates fast whenever billing staff turn over. It separates practices that recover revenue from practices that write it off.
How to build an appeal that reaches the right level with the right documentation
Premier Inc. data puts the internal appeal's overturn rate at 70%, and that figure isn't a passive statistic. It reflects claims that were appealed with real clinical rationale attached, not a copy of the original claim resubmitted with a cover letter. A file that just repeats the original submission almost never moves a payer that already denied it once.
IRO-level appeals succeed 46.7% of the time even after the internal appeal already failed twice, and the reason the number climbs at that stage despite a heavier documentation load, often multiple letters from treating physicians, caregivers, and the patient, is that the reviewer on the other end isn't the payer anymore. The reviewer on the other end isn't the payer anymore, and that single fact changes the entire calculus of what's worth escalating.
Service type should drive triage. Home healthcare denials overturn at 78.4% at the IRO stage, the strongest track record of any category in the JAMA data, followed by surgical services, pharmacy and prescription drug denials, mental health services at 60.6%, and substance abuse treatment at 61%. Those categories deserve a default policy of escalation rather than case-by-case deliberation.
Payer identity should drive it too. A Centene Medicare Advantage denial, given a 93% MA overturn rate for that insurer, warrants near-automatic escalation rather than a judgment call, while a payer with a documented low overturn rate calls for a more selective approach, reserving appeal effort for the cases with the strongest clinical footing. Denials aren't uniform, and neither is the payoff from fighting them. The data across every level, internal, second-level, and IRO, points to the same conclusion: the appeal system works. It just only works for the practices willing to use it all the way through.
Sources
- More insurance claims denials are being overturned upon appeal, study finds
- News: Insurance denials overturned at high rates by independent review experts, analysis says | ACDIS
- Payers Ranked by Denial Rates 2025
- Medical Billing Denial Statistics 2026: Industry Data & Benchmarks
- Medicare Advantage Prior Auth Denial Spike
- Prior Authorization Denied? How to Appeal and Win (2026 Rules) - Health Bill Central
- Prior Authorization Metrics Provide New Insights into Insurer Practices, but Gaps Remain | KFF
- 50+ US Healthcare Denial Rates & Reimbursement Statistics for 2026