Prior Authorization Denial Trends Across Major Commercial Payers
Data shows payers deny prior authorizations at wildly different rates under identical rules.
Prior authorization denial rates went public in 2026, and the CMS data confirms what practices have suspected for years without proof: payers in the same market, under the same federal rules, deny care at wildly different rates. The spread between the most restrictive and least restrictive insurer within a single segment runs as high as 23 percentage points. That gap is the real finding here, not the averages regulators keep citing. It means the decision to fight harder with one payer and less with another belongs on a spreadsheet now, not in a biller's gut instinct.
The averages across Medicare Advantage, Medicaid, and the ACA marketplace
KFF's August 2026 analysis looked at 2025 data from the 14 insurers with the largest enrollment in each market, covering roughly 71 million people. The average standard prior authorization denial rate came in at 12% for Medicare Advantage, 14% for Medicaid managed care, and 18% for ACA marketplace plans. Expedited requests fared a bit better across the board.
Treating those averages as the finding is the first mistake most practices make: the averages are close to useless. They're a floor, not a picture. Split each segment out by individual payer and the operating reality looks nothing like the topline suggests.
How far denial rates spread within each market segment
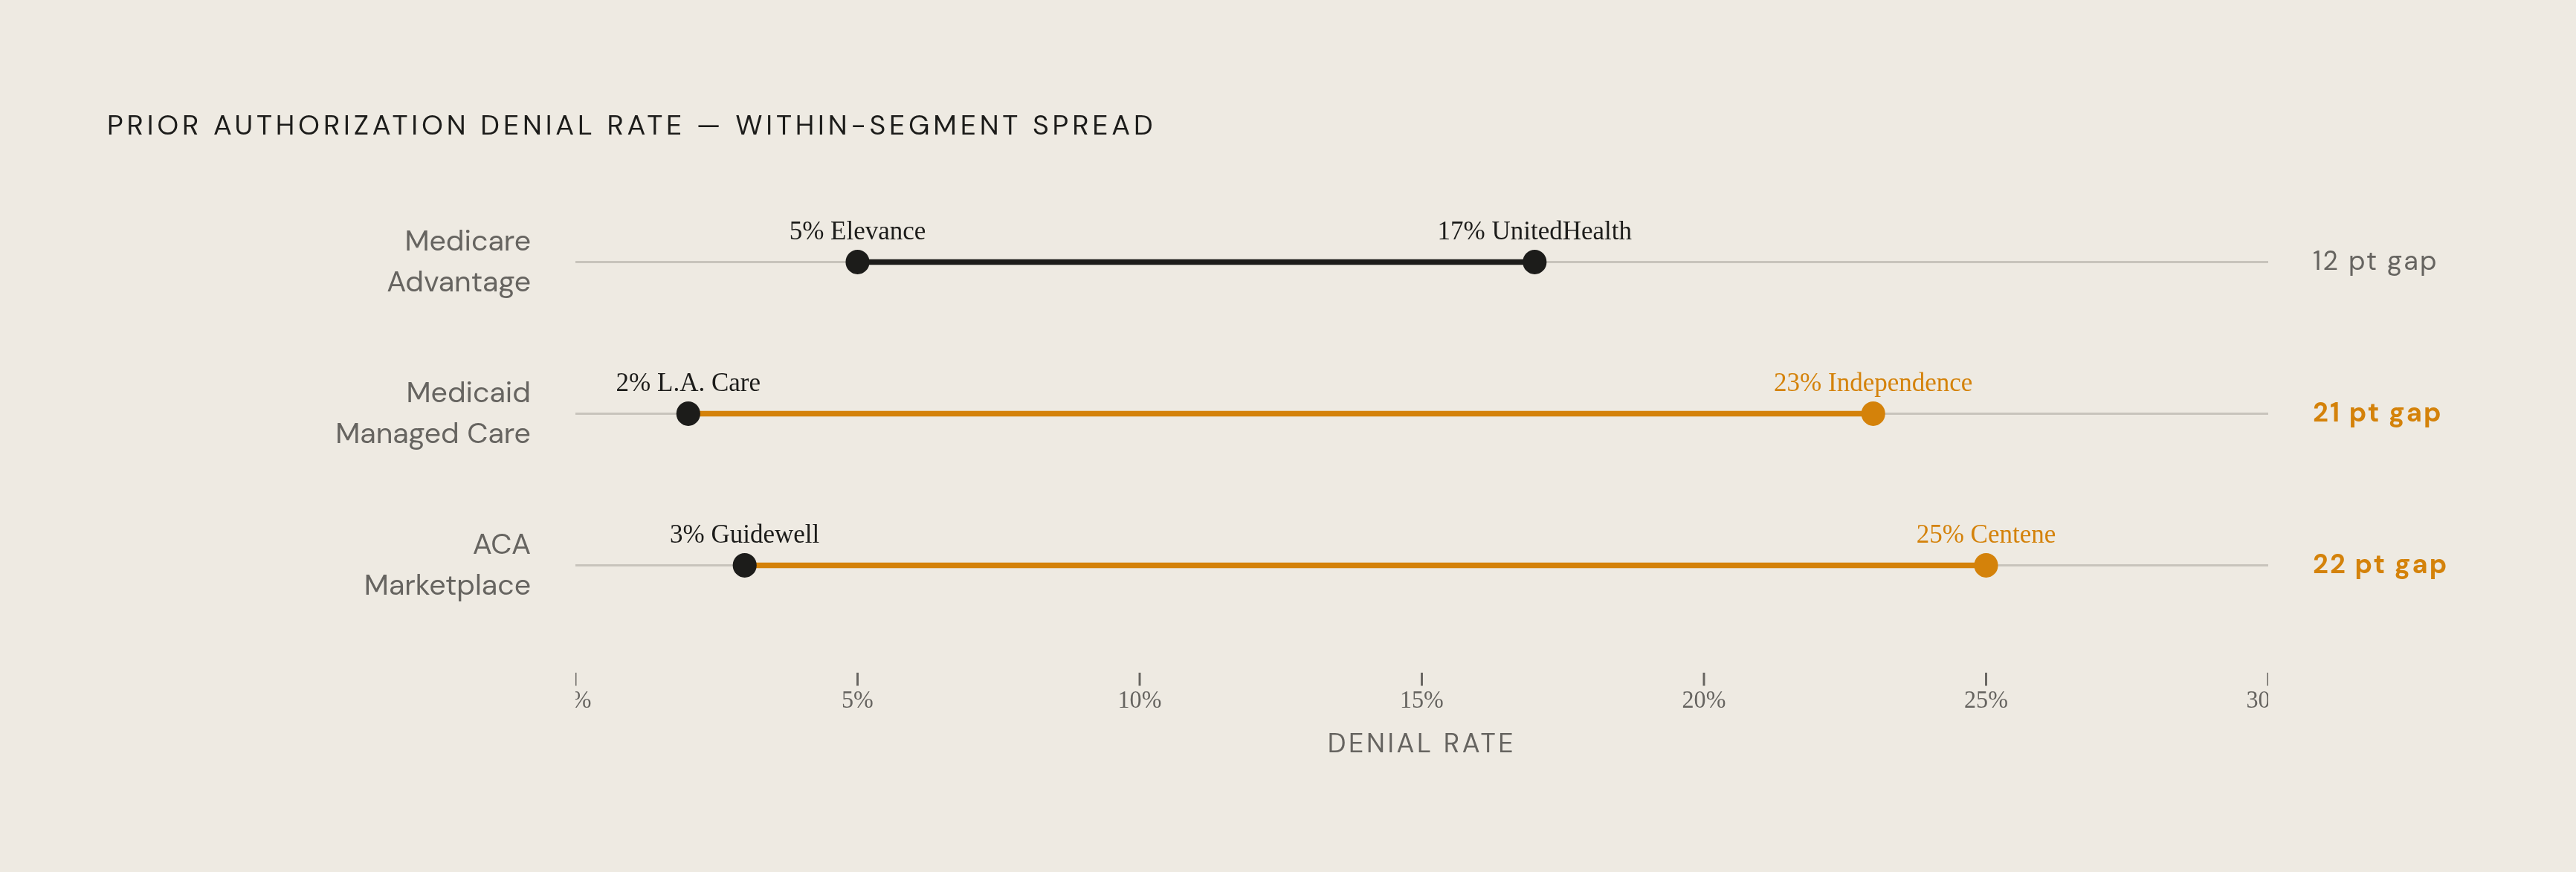
Start with Medicare Advantage. Elevance denied just 5% of standard prior auth requests in 2025, the lowest rate in the segment. UnitedHealth denied 17%, the highest. That's a 12-point gap between two plans working under identical CMS rules, covering the same category of patient, and there's no clinical reason for it.
Medicaid managed care spreads even wider. L.A. Care Plan denied only 2% of requests. Independence Health Group's Blues plans denied 23%, over ten times that rate. The ACA marketplace tells the same story with different names: Guidewell at 3%, Centene at 25%.
Zoom out beyond the largest insurers and the spread widens further, with the steepest numbers clustered among Qualified Health Plans on the exchanges. A practice contracting with UnitedHealth's MA plan is looking at more than three times the authorization friction of one contracting with Elevance's MA plan. Same rules, same federal framework, and none of that gap traces back to regulation. It comes from internal payer policy, full stop.
Practices that treat every payer as roughly interchangeable when they build authorization workflows are misallocating staff time by definition. They overinvest in the low-friction payers and underinvest in the ones that actually eat the week. That's a major inefficiency. It's the wrong bet, made on purpose, over and over.
What overturn rates on appeal reveal about initial denial quality
Sixty-seven percent of appealed Medicare Advantage denials got overturned in 2025, per KFF. Medicaid managed care organizations reversed 47% of appeals, and ACA marketplace plans approved 43% of what got appealed. Those aren't close calls. When two out of three denials collapse under a second look, the first denial was never really a clinical judgment. It was a process output that didn't survive scrutiny, and calling it anything else is generous.
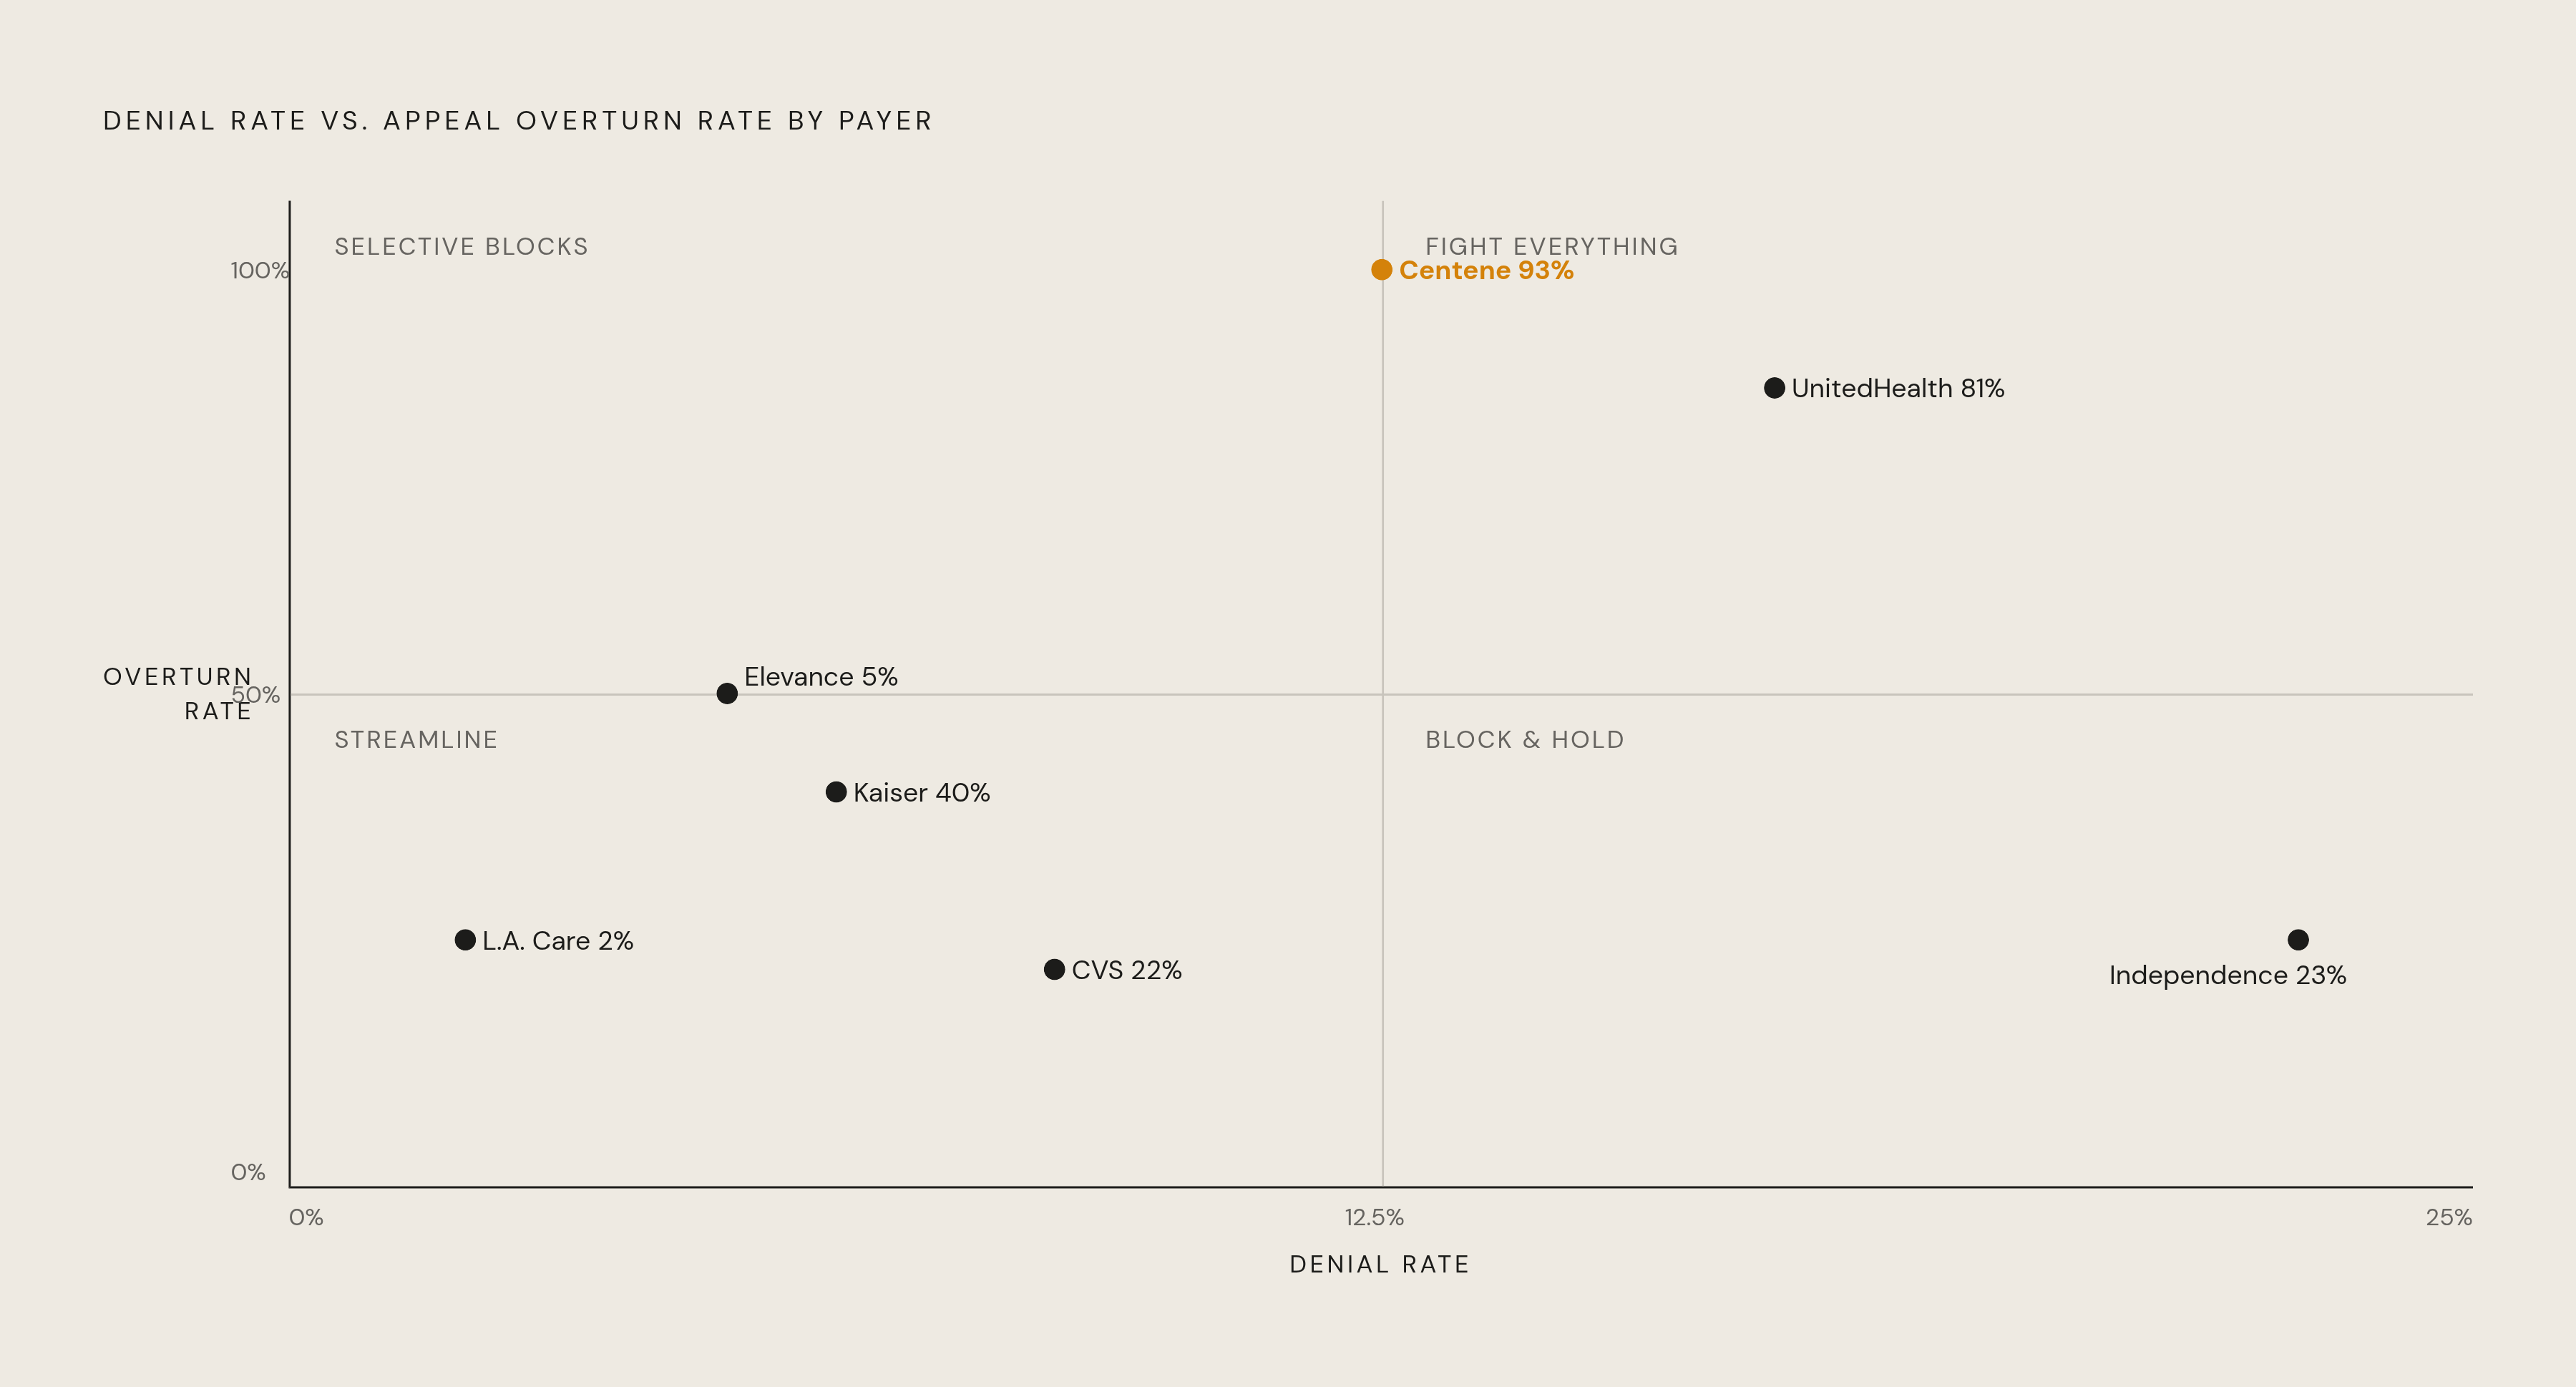
The overturn rate splits by payer just as sharply as the denial rate does. In Medicare Advantage, Centene overturned 93% of appealed denials, the highest in the segment, while Kaiser Permanente overturned only 40%, the lowest. In Medicaid, UnitedHealth Group reversed 81% of appeals, and CVS reversed just 22%.
Pair that with a separate number: at UnitedHealth, only 0.2% of denied members filed an appeal, a figure that likely understates how rarely appeals get filed across the industry. Almost all the reversible denials in this country just sit there, unrecovered, because nobody challenged them. That gap, between how often an appeal wins and how rarely one gets filed, is where practices bleed money they were already owed.
Read denial rate and overturn rate side by side and a strategy falls out of it. A payer like Centene, high denial and high overturn, calls for a fight-everything posture in Medicare Advantage. A payer like Kaiser, low overturn, calls for something far more selective. Treating every denial the same regardless of source wastes effort on cases that were never going anywhere, and it abandons the ones that were winnable from the start.
The role of automated review tools in driving denial volume
Somewhere between 8% and 12% of health plans now use AI to process prior authorization denials, and 61% of physicians in a 2024 AMA survey said they believe payer AI is driving denials up. Two cases explain why that suspicion has teeth, and neither is speculative.
Cigna's PxDx algorithm denied more than 300,000 claims in a two-month stretch, averaging 1.2 seconds of review per claim. One point two seconds is a rubber stamp. It's a rubber stamp with extra steps. A California federal judge let part of the resulting class action move forward in March 2025, ruling that handing decisions off to an algorithm might violate the terms of the plan itself. Cigna has pushed back, with a spokesperson describing the tool as a sorting technology used for more than a decade, not an algorithm making medical decisions.
UnitedHealth's nH Predict tool is the more serious case, carrying an alleged error rate of 90%. A Minnesota federal judge ruled in February 2025 that breach of contract and good faith claims against UnitedHealth could proceed, and on March 9, 2026, that same court ordered the company to hand over internal nH Predict documents, including records addressing whether the tool was built to override physician judgment from the start.
Set that against UnitedHealth's own numbers: the highest MA denial rate in the KFF dataset, 17%, alongside a new digital prior auth tool the company says approves claims at a 96% rate. A company cannot simultaneously deny the most claims in its segment and claim its automation approves nearly everything, unless those two systems are doing very different jobs. The litigation, plus the March document order, will likely say more about which story is true than either company's press release does.
For a practice managing this day to day, whether a payer uses AI matters less than what its denial rate and overturn rate say together. A high-denial, high-overturn combination is the signal that systematic over-denial is happening, whatever tool produced it. That combination, not the presence of AI, is what should set the appeal posture.
How the reform environment is changing, and what it has not yet changed
CMS-0057-F is already reshaping the baseline. For Medicare Advantage, Medicaid, and CHIP plans (not ACA plans), standard decisions now have to come within seven calendar days, urgent ones within 72 hours, and every denial has to include a specific reason, delivered through the portal, fax, email, mail, or phone. Starting in 2027, payers have to stand up prior auth APIs, provider access APIs, payer-to-payer APIs, and an expanded Patient Access API that folds in prior authorization data.
Roughly 50 plans, including all six of the largest publicly traded insurers, Elevance Health, Centene, Cigna, CVS Health's Aetna, Humana, and UnitedHealthcare, signed AHIP's voluntary pledge in June 2025. The 2026 commitments include cutting the number of services subject to prior auth and honoring existing approvals through coverage transitions, with a 90-day transition window that took effect January 1, 2026. The 2027 commitments go further: real-time approval on most requests, standardized electronic submission, and at least 80% of electronic approvals processed in real time. As of April 2026, major insurers reported an 11% overall reduction in prior authorizations, and a 15% reduction in Medicare Advantage specifically, according to AHIP's own survey. Take that number for what it's worth: the insurers grading their own homework here are the same ones the KFF data caught spread 12 points apart.
States are moving too, unevenly but faster than Washington in places. Texas, Louisiana, Michigan, Vermont, and West Virginia all run gold-carding programs that waive prior auth for providers with strong track records; Texas sets that bar at a 90% approval rate for a given service. Rhode Island went further, eliminating prior auth entirely for services ordered by a primary care provider in the normal course of treatment, a three-year pilot that started October 1, 2025. Several states passed laws in 2025 restricting payer use of AI in coverage determinations, with more expected in 2026. Twenty-three states plus a federal capital jurisdiction have adopted the NAIC's AI Model Bulletin, and California's Physicians Make Decisions Act took effect January 1, 2025.
A federal legislative proposal, the Improving Seniors' Timely Access to Care Act, has 248 House co-sponsors and 64 Senate co-sponsors, a bipartisan supermajority by any count. It still hasn't passed, and a pledge is not a contract. The payer-level spread the KFF data captured was recorded while all of this reform pressure was already public and active, which means the numbers show payer behavior under scrutiny. Nobody yet knows what the spread looked like before the cameras were on, and there's good reason to guess it was worse.
What the administrative burden on practices looks like alongside these denial rates
The 2024 AMA survey put the average practice at 39 prior authorizations per physician per week, with physicians and staff spending about 13 hours a week on the paperwork alone. Nearly a third of physicians, 29%, said prior authorization had led to a serious adverse event for a patient, including hospitalization, permanent disability, or death.
Kodiak Solutions, drawing on data from more than 2,100 hospitals and 300,000 physicians, put the overall initial claim denial rate at 11.81% in 2024, up 2.4% from the year before. What's driving that increase is the strange part. Providers actually cut prior-auth-specific initial denials by 7.7% in 2024. But medical necessity denials rose 5%, and requests-for-more-information denials rose 5.4%, more than erasing the gain.
Practices that fixed their prior auth compliance found the goalposts had simply moved. Denial pressure didn't disappear. It shifted category, and anyone measuring success by the old metric alone missed the shift.
Accounts receivable days rose 5.2% year-over-year in the same Kodiak data, meaning payment takes longer even where PA workflows have gotten cleaner. A State of Patient Access survey found 56% of providers naming patient information errors, wrong demographics, eligibility mismatches, as a primary cause of denials in their own right, on top of whatever the payer's authorization policy adds.
Run 39 prior auths per physician per week against a denial rate that swings by more than 20 percentage points depending on which payer is on the other end, and the conclusion is unavoidable: practices stuck with the highest-denying payers are burning a disproportionate share of staff time chasing decisions that were likely to get reversed anyway.
How practices can use payer-level denial data to sharpen their authorization strategy
The public data supports one clear move: treat each contracted payer as its own case, not one workflow applied across the board. The spread between best and worst performers, in every segment, makes a uniform approach indefensible. Practices that keep running one playbook for every payer are choosing to lose money, whether they'd put it that way or not.
Two numbers matter most for each payer a practice deals with. The denial rate sets the baseline expectation, how often a submission is going to need follow-up. The overturn rate says how hard to push back. A high overturn rate means appeals are worth filing every time, not just when staff happen to have the bandwidth. Together, those two figures tell a practice whether it's dealing with a high-volume-low-fight payer or a high-volume-high-fight one.
Knowing Centene's MA overturn rate is 93% only pays off if someone actually files the appeal, and filing well takes documentation, timing, and a working knowledge of what that specific payer's reviewers respond to. That's institutional memory. It gets earned over months of filings, not looked up in a table.
Front-end accuracy still matters no matter which payer is on the other end. Eligibility errors and demographic mistakes account for a real share of denials before payer behavior ever enters the picture, and catching those before submission is the cheapest fix available to any billing office.
The federal rule stops short of one thing practices actually need: a breakdown by service type. Payers report percentages, not which specific procedures get denied most, so that detail still has to come from a practice's own claims history and its own pattern of denials across its payer mix.
That kind of payer-specific knowledge disappears the moment billing staff turn over. It's a compounding asset if maintained, and a total loss if it lives in one person's head. Practices that combine the new CMS disclosure data with their own claims history, and with a billing operation built to track payer behavior over time instead of relearning it every year, are the ones positioned to build an authorization strategy that matches how payers actually behave, not how the industry pretends they all behave the same.
Sources
- Claims denial rates up, prior auth denials down in 2024: Report - Becker's Payer Issues | Payer News
- Payers’ prior authorization denial rates go public: 5 notes
- Prior authorization denials vary widely among insurers, first-of-its-kind data shows
- KFF: Insurers Denied 12%-18% of Prior Authorization Requests in 2025 - MedCity News