Claim Leak Diagnostics Every Private Practice Owner Should Run Before Hiring a Single Biller
Measure where revenue leaks before hiring staff to plug the holes.

Claim leak diagnostics give private practice owners a sound basis for choosing revenue cycle management services or hiring a biller. The right sequence is to measure where claims lose value, compare the results with specialty benchmarks, and match the fix to the failure. More billing capacity is justified when the evidence shows a capacity gap.
Why measuring revenue loss before hiring a biller is the right sequence
An owner sees that accounts receivable are aging and posts a job for a biller. There are more claims, payments have slowed, and the front desk has more work than it can handle. The response is understandable, but the diagnosis is missing. Without measurement, a new biller inherits the same broken process, with added payroll but no clear account of what must change.
Different losses require different interventions. A denial spike from missing prior authorizations is not the same problem as eligibility errors at registration or delayed patient billing. Each failure begins at a different point in the workflow, so assigning them all to billing obscures responsibility. The practice first needs to distinguish slow submission, weak denial follow-up, front-desk errors, and a billing model that no longer fits its workload.
What denial rate, clean claim rate, and days in AR actually measure, and where the benchmarks come from
Initial denial rate measures the share of submitted claims denied on their first adjudication. Final denial rate is the share that stays denied after all appeals, which separates claims that can still be recovered from permanent claim loss. The denominator changes the meaning of either figure. A rate calculated against submitted claims is not directly interchangeable with one calculated against adjudicated claims, and a count-based rate does not show the concentration of dollars in high-value denials.
Clean claim rate shows which claims get through the first submission without rework, but comparing it with benchmarks takes a precise calculation. Under HFMA MAP Key definitions, the standard calculation is claims that pass edits without manual intervention divided by claims accepted into the claims processing tool. Practices that use a broader first-pass acceptance measure should make clear how it differs from the HFMA calculation before they compare results.
Days in AR measures the average time needed to collect payment after services are billed. The healthy target is 30 to 40 days, with best-in-class practices below 30. Source selection is just as important as calculation. MGMA Financials and Operations DataDive allows comparisons by specialty, geography, and organization size, helping practices choose a relevant peer group. Hospital benchmarks reflect how hospitals work, so they should not serve as targets for physician practices.
How denial trends have shifted in 2026 and why surface improvement can mislead
Experian Health's 2025 State of Claims survey found that the share of providers who reported high denial rates rose sharply between 2022 and 2025. That establishes the broader pressure, but it does not explain every practice's results. Payer mix changes the interpretation of the trend. Revenue Synergy's 2026 RCM Benchmark Report, which draws on more than 500 rendering providers, found that denial increases were mostly in Medicare Advantage, while original Medicare denial rates stayed about the same year over year.
Initial denial rates also miss losses that occur after payment. WeBill Health's 2026 benchmark paper describes payers approving and paying claims, then auditing them and recovering payment afterward. A practice with a lower front-door denial rate may still keep less revenue, especially when Medicare Advantage plans have tightened medical necessity edits and added more post-payment audits.
The methodological consequence is straightforward. Practices need to track recoupment separately and read initial denials together with final denials, net collections, and days in AR. An acceptable initial rate can coexist with worsening collections because payments are recovered later or denied claims remain unworked. Surface improvement is meaningful only when the measures of retained revenue and collection time support it.
The five diagnostics a practice should run before making any billing decision
The first diagnostic measures initial denials by both claim count and dollars. HFMA's Claim Integrity Task Force method counts first denials against submitted claims and excludes corrected and replacement claims. Calculate both views because high-value denials can be concealed by an acceptable claim-count rate. Track rejections separately, since rejected claims do not reach adjudication and can distort comparisons based on adjudicated claims. Then calculate final denials after appeals. A wide initial-to-final gap shows that claims are being recovered, while a narrow gap calls for a look at whether appeals are being pursued and why they fail.
For the second diagnostic, locate recurring causes by pulling claim adjustment reason codes, or CARCs, from 835 remittance files for a recent period and grouping them into categories. Separate eligibility errors, demographic mismatches, and missing authorizations from documentation gaps, medical necessity disputes, and modifier errors. Location determines who can prevent the next denial. Track individual CPT line denials separately from whole-claim denials because claim-level aggregation can conceal lost revenue on individual services. The resulting distribution shows whether the break begins at registration, scheduling, documentation, coding, or follow-up.
The third diagnostic measures collection delay overall and by payer bucket. Segment AR into original Medicare, Medicare Advantage, Medicaid, commercial coverage, and patient responsibility, then examine the over-90-days balance as a share of total AR. An overall average can hide a concentrated backlog. The benchmark report attributes AR deterioration to both commercial prior-authorization backlogs and pended Medicare Advantage claims, with authorization-heavy specialties absorbing much of the slippage. A growing over-90-days balance signals that denials may not be worked promptly, but does not by itself establish a staffing shortage.
Calculate net collection rate after contractual adjustments, with a result below 95% showing that some revenue has gone uncollected. Then identify the share of denied claims never reworked or appealed. Luxen's billing review data found that nearly one in five denied claims across the practices it reviewed were never pursued, while a high share of filed appeals were overturned. That distinction changes the proposed fix substantially. When pursued denials are regularly recovered but others remain untouched, the immediate gap is in follow-up workflow and capacity, which process or technology may address before staffing.
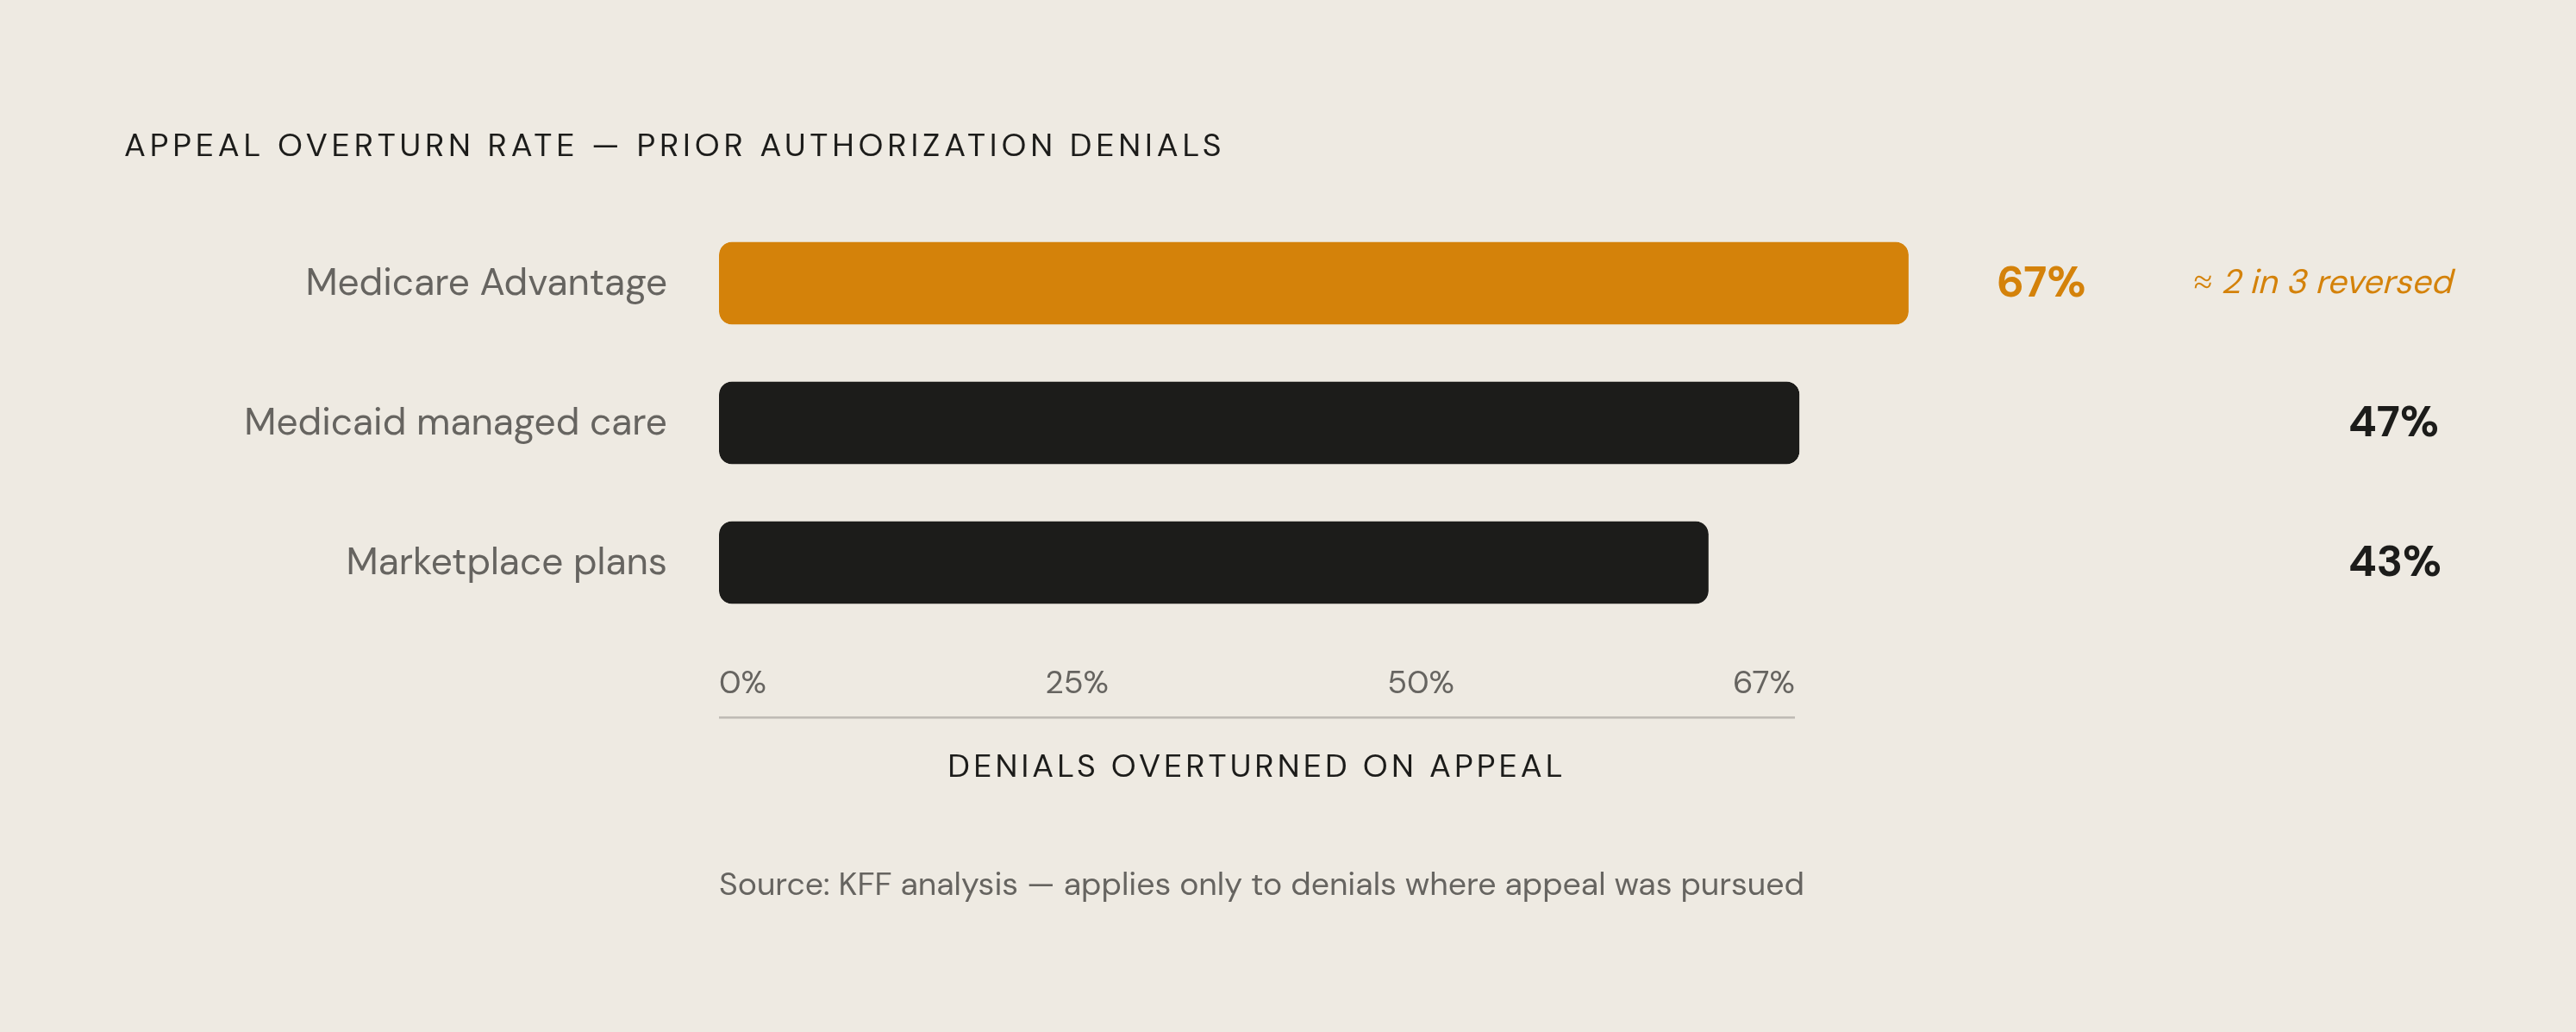
The fifth diagnostic checks how well prior authorization works for the practice's top 10 procedure codes by volume. For each code and major payer, verify whether authorization is currently required, the approval rate, approval time, and reasons for denial. A checklist untouched for the past 12 months risks preventable denials as requirements change. Review current peer-to-peer deadlines and expedited appeal timelines as well, because shortened windows can defeat appeals before their merits are considered. KFF data cited in the benchmark paper show that, among prior authorization denials that were appealed, overturn rates were 67% in Medicare Advantage, 47% in Medicaid managed care, and 43% in Marketplace plans. These rates apply to appeals that were pursued and leave open whether any given denial can be recovered.
How the diagnostic results shift by specialty, and what that means for interpreting your numbers
Specialty benchmarks describe operating conditions. The report uses claim-level data from January through December 2025, and its methodology describes 22 specialty cohorts, although its headline description refers to 12 specialties. The report states that its results were compared with MGMA DataDive and AAPC benchmarks and fall within one standard deviation of broader industry norms. It remains a reference drawn from one firm's client base.
Primary care is the closest to national targets. Its AR days sit in the high twenties, denial rates in the high single digits, clean claim rates in the mid-to-high nineties, and net collection rates in the low nineties. Orthopedics has AR days in the mid-thirties, denials above the medical group average, clean claim rates in the mid-nineties, and net collections in the high eighties. Procedure coding, modifiers, and surgical authorization documentation drive the orthopedic denial burden. The comparison shows why a primary care baseline can overstate the apparent gap in a procedural practice.
Cardiology approaches forty AR days, with denial rates in the low teens, clean claim rates in the low-to-mid nineties, and net collections in the upper eighties. Prior authorization and medical necessity challenges are its main drivers. Behavioral health faces a different administrative burden. Its AR days reach the low forties, denials the mid-teens, clean claim rates the low nineties, and net collections the mid-eighties. Payer carve-outs introduce subcontractors with separate enrollment, authorization, and adjudication requirements, while session-based authorization adds another source of failure.
Radiology has AR days in the mid-to-upper thirties, with a median of 36.8, denial rates among the report's highest, clean claim rates in the low nineties, and net collections in the mid-eighties. Those losses come from pre-approval requirements and failures to meet administrative rules. The report found that authorization-heavy specialties, including radiology, oncology, and behavioral health, experienced the most deterioration, while established peer-to-peer escalation paths and dedicated authorization workflows limited drift. Specialty position establishes the severity of a gap. Its cause determines which intervention can close it.
How can a practice stop losing money on claims, and when is hiring the right answer?
Eligibility mismatches, missing authorizations, and demographic errors point to real-time eligibility verification before every visit, a maintained authorization checklist, and demographic validation at entry. These are registration and scheduling responsibilities. When initial denials are high but final denials are low, claims are being recovered, but that recovery takes a lot of work. Finding denials sooner and using a workflow that handles each one as it arrives can cut the need to hold them in weekly review queues.
High initial and final denial rates require closer attention to unrecovered claims. Where recoverable denials are being written off, the practice needs better identification and an active appeals process. Additional human or automated capacity may then be justified. But when AR above 50 days is mostly in one payer bucket, the practice needs knowledge and fixes specific to that payer, with less reason to add staff across the practice. If net collections below 95% instead arise from patient balances, earlier and clearer patient billing is the appropriate lever.
A hire is justified when claim volume has genuinely outpaced submission and follow-up capacity while denial and AR measures remain in range. The diagnostic findings then define the job's responsibilities. A billing partner is another option when the practice has more claims and more complex work than its team can handle, especially when it risks losing staff and the knowledge they take with them. For small private practices evaluating revenue cycle management services, concrete selection criteria include integration with existing EMR and clearinghouse workflows, claim scrubbing, denial management, and payer-specific follow-up. Visibility should let the practice see the measures used in these diagnostics as well as the overall collection figure.
Run the five diagnostics, interpret the findings against specialty peers, and address the gap with a registration change, a stronger denial workflow, payer-specific expertise, earlier patient billing, or additional capacity as needed. Diagnose first, then decide what the practice needs to buy or build.