CMS Physician Fee Schedule Changes and Practice Revenue Projections
CMS cuts procedural RVUs by 2.5% while exempting office-based visit codes.

CMS finalized a –2.5% reduction to intra-service times and work RVUs across nearly all non-time-based codes. This is not a small technical tweak. It cuts directly the value CMS assigns to the work involved in procedural services, and it applies broadly.
The 3.26% conversion factor increase and the 2.5% work RVU reduction on procedural codes do not cancel each other out cleanly, and for surgical and cardiology practices the net is worse than that arithmetic alone suggests. Because the RVU cut applies to non-time-based procedural codes while E&M and time-based codes are fully exempt, the conversion factor headline reflects a blended average across all service types; a practice whose revenue is concentrated in procedural volume sees the 2.5% RVU reduction applied to most of what it bills, with far less of the offsetting gain. For hospital-based cardiology in particular, the site-of-service practice expense restructuring stacks on top of the efficiency adjustment: facility-based procedures such as pacemaker implants, TAVR, PCI, and ablation face total RVU reductions of around 10%, meaning the two cuts land on the same codes simultaneously. The practical upshot is that a procedure-heavy surgical or interventional cardiology practice should model 2026 revenue at the service-line level, because the conversion factor headline will not tell that practice anything useful about what it actually collects next year.
The exemptions matter as much as the cut itself. Evaluation and management services, care management, behavioral health, telehealth, and certain maternity care codes are carved out. Those are, not coincidentally, the visit-based and time-based services that make up the bulk of what office-based primary care and cognitive specialties bill. The specialties left holding the –2.5% reduction are the ones whose revenue depends on procedural volume: radiology, cardiology, surgery, pathology, anesthesiology.
Run the arithmetic and the picture sharpens. The conversion factor climbs 3.26% for most clinicians, but work RVUs on procedural codes drop roughly 2.5%. Net that out and the actual payment increase for a lot of procedural work is compressed to a fraction of the headline figure, sometimes close to flat. A practice heavy on procedure volume needs to model 2026 revenue at the service-line level. The conversion factor headline will not tell that practice anything useful about what it collects next year.
How does the site-of-service PE restructuring shift payment between facility and office settings?
CMS also changed how indirect practice expense RVUs get allocated between facility and non-facility settings, and this shift is arguably more consequential than the efficiency adjustment for the specialties it touches. For services furnished in hospital settings, the portion of indirect PE allocated based on work RVUs gets cut by 50% starting in 2026.
The American College of Cardiology's analysis of this change is worth sitting with. Facility-based procedures like pacemaker implants, TAVR, PCI, and ablation face total RVU reductions of around 10% under the new methodology. That is a real number, not a rounding effect. The redistribution runs in one direction: office-based specialties gain ground, hospital-based specialties lose it.
CMS itself projects cardiology's net payment impact at roughly 1% positive, but the ACC has been clear that this estimate depends heavily on an individual practice's patient and service mix. A cardiology group doing most of its volume in hospital-based interventional work will not experience a 1% gain; it will experience the loss embedded in the facility-based procedure cuts, without much of the offsetting gain that office-based E&M codes elsewhere in the specialty might generate.
One line item deserves specific mention. CMS set a single averaged payment rate of $127.28 for skin substitutes, applied across both hospital outpatient departments and physician practices. For practices that use skin substitute products with any frequency, particularly in wound care, this represents a significant reduction from prior reimbursement and it lands regardless of setting.
The upshot: two physicians in the same specialty, one billing from an office and one from a hospital-based practice, will walk away from this rule with materially different revenue trajectories. Same specialty, same fee schedule, different outcome. That is the nature of a budget-neutral rule; someone has to fund the gains.
Where certain practices actually come out ahead: APCM and the visit-based exemptions
Primary care and internal medicine practices are positioned better than most under this rule, and it is worth naming why plainly rather than treating every specialty as equally exposed. Time-based E&M codes sit outside the –2.5% efficiency adjustment. Their RVUs hold steady while procedural RVUs get cut.
Layered on top of that exemption is a new billing opportunity. Starting January 1, 2026, Advanced Primary Care Management (APCM) codes let practices bill for comprehensive care coordination work that, in many cases, they are already doing without separate reimbursement. To bill APCM, a practice has to document 13 required service elements, including 24/7 patient access, management of care transitions, and a comprehensive care plan. That is a real documentation lift, not a rubber stamp, and practices that wait until January to build the workflow will lose billing time.
One constraint worth flagging before anyone builds a workflow around it: APCM can be billed alongside remote patient monitoring, but not alongside chronic care management. That is a hard exclusion, and a practice that tries to layer APCM on top of an existing CCM program will run into a billing conflict it should have anticipated at the design stage, not discovered at the claim stage.
Practices of a specific kind stand to benefit here: primary care, internal medicine, family medicine, anyone running a chronic disease panel with care management infrastructure already in place. For those practices, 2026 offers a genuine upside that procedural specialties do not share.
CMS also held the MIPS performance threshold at 75 points through the 2028 performance period. That stability matters more than it sounds. Practices sitting above that threshold can plan multi-year quality strategy without worrying about a moving target, which is not something MIPS has offered consistently in past years.
One more structural change worth noting for the specialties it touches: CMS created a new mandatory Ambulatory Specialty Model. It does not affect every practice, but for the specialty groups it does affect, it is a new participation requirement worth understanding well before it takes effect.
How Medicare Advantage rate increases interact with (and diverge from) the PFS changes
CMS increased payments to Medicare Advantage plans by an average of 5.06% for 2026, a larger percentage than the PFS conversion factor increase most clinicians receive. It would be a mistake to read that as good news for practices with heavy MA panels, because that 5.06% goes to the plan. What the practice actually collects depends entirely on the contract it holds with each individual MA plan, and MA plans carry no obligation to pass that rate increase through to physicians at the same percentage, or at all.
This is where MA denial behavior becomes relevant to a revenue conversation rather than just a clinical administration headache. KFF's 2025 analysis, covering roughly 71 million enrollees across Medicare Advantage, Medicaid managed care, and ACA Marketplace plans, found that MA plans denied 12% of standard prior authorization requests. That figure is an average; individual insurers ranged from 5% at Elevance to 17% at UnitedHealth Group.
A practice whose MA panel skews toward the higher-denial end of that range receives less of the 5.06% capitation increase in practical terms, because a share of the revenue that increase is meant to fund never clears adjudication in the first place. The PFS conversion factor and the MA capitation rate are two separate levers, set through two separate processes, and they move independently of each other. Tracking one without the other gives a practice half the picture.
Why payer policy lag turns rate increases into delayed or partial revenue
CMS effective dates and payer effective dates are not the same thing, and the gap between them is where a lot of otherwise-earned revenue gets stuck. Commercial and MA payers update fee schedules, medical necessity criteria, and prior authorization lists on their own internal schedules, and those schedules routinely run months behind a CMS effective date.
The consequence is mechanical. A claim submitted correctly under the new PFS, with the right code and the right RVU expectation, can still get denied if the payer's system hasn't caught up. Or a practice sets revenue expectations off last year's fee schedule because nobody has confirmed that the payer's updated policy has actually loaded on their end.
The KFF data on prior authorization appeals makes the cost of this lag concrete. Sixty-seven percent of MA prior authorization denials get overturned on appeal. That is not a marginal error rate; it means the initial denial was wrong more often than it was right, in a majority of appealed cases. Every one of those overturned denials represents revenue a practice earned, submitted correctly, and still had to fight for before collecting.
Timing compounds the damage. Claims that age significantly beyond standard payment windows see collection probability decline sharply the longer they remain unresolved. Payer policy lag is not simply an inconvenience that resolves itself eventually. It is a revenue leak with a deadline attached, and that leak widens whenever a fee schedule transition introduces new codes or revised RVU values that payers have not yet loaded into their adjudication systems, which is exactly the situation the 2026 PFS creates.
What prior authorization volume and appeal rates reveal about real revenue capture
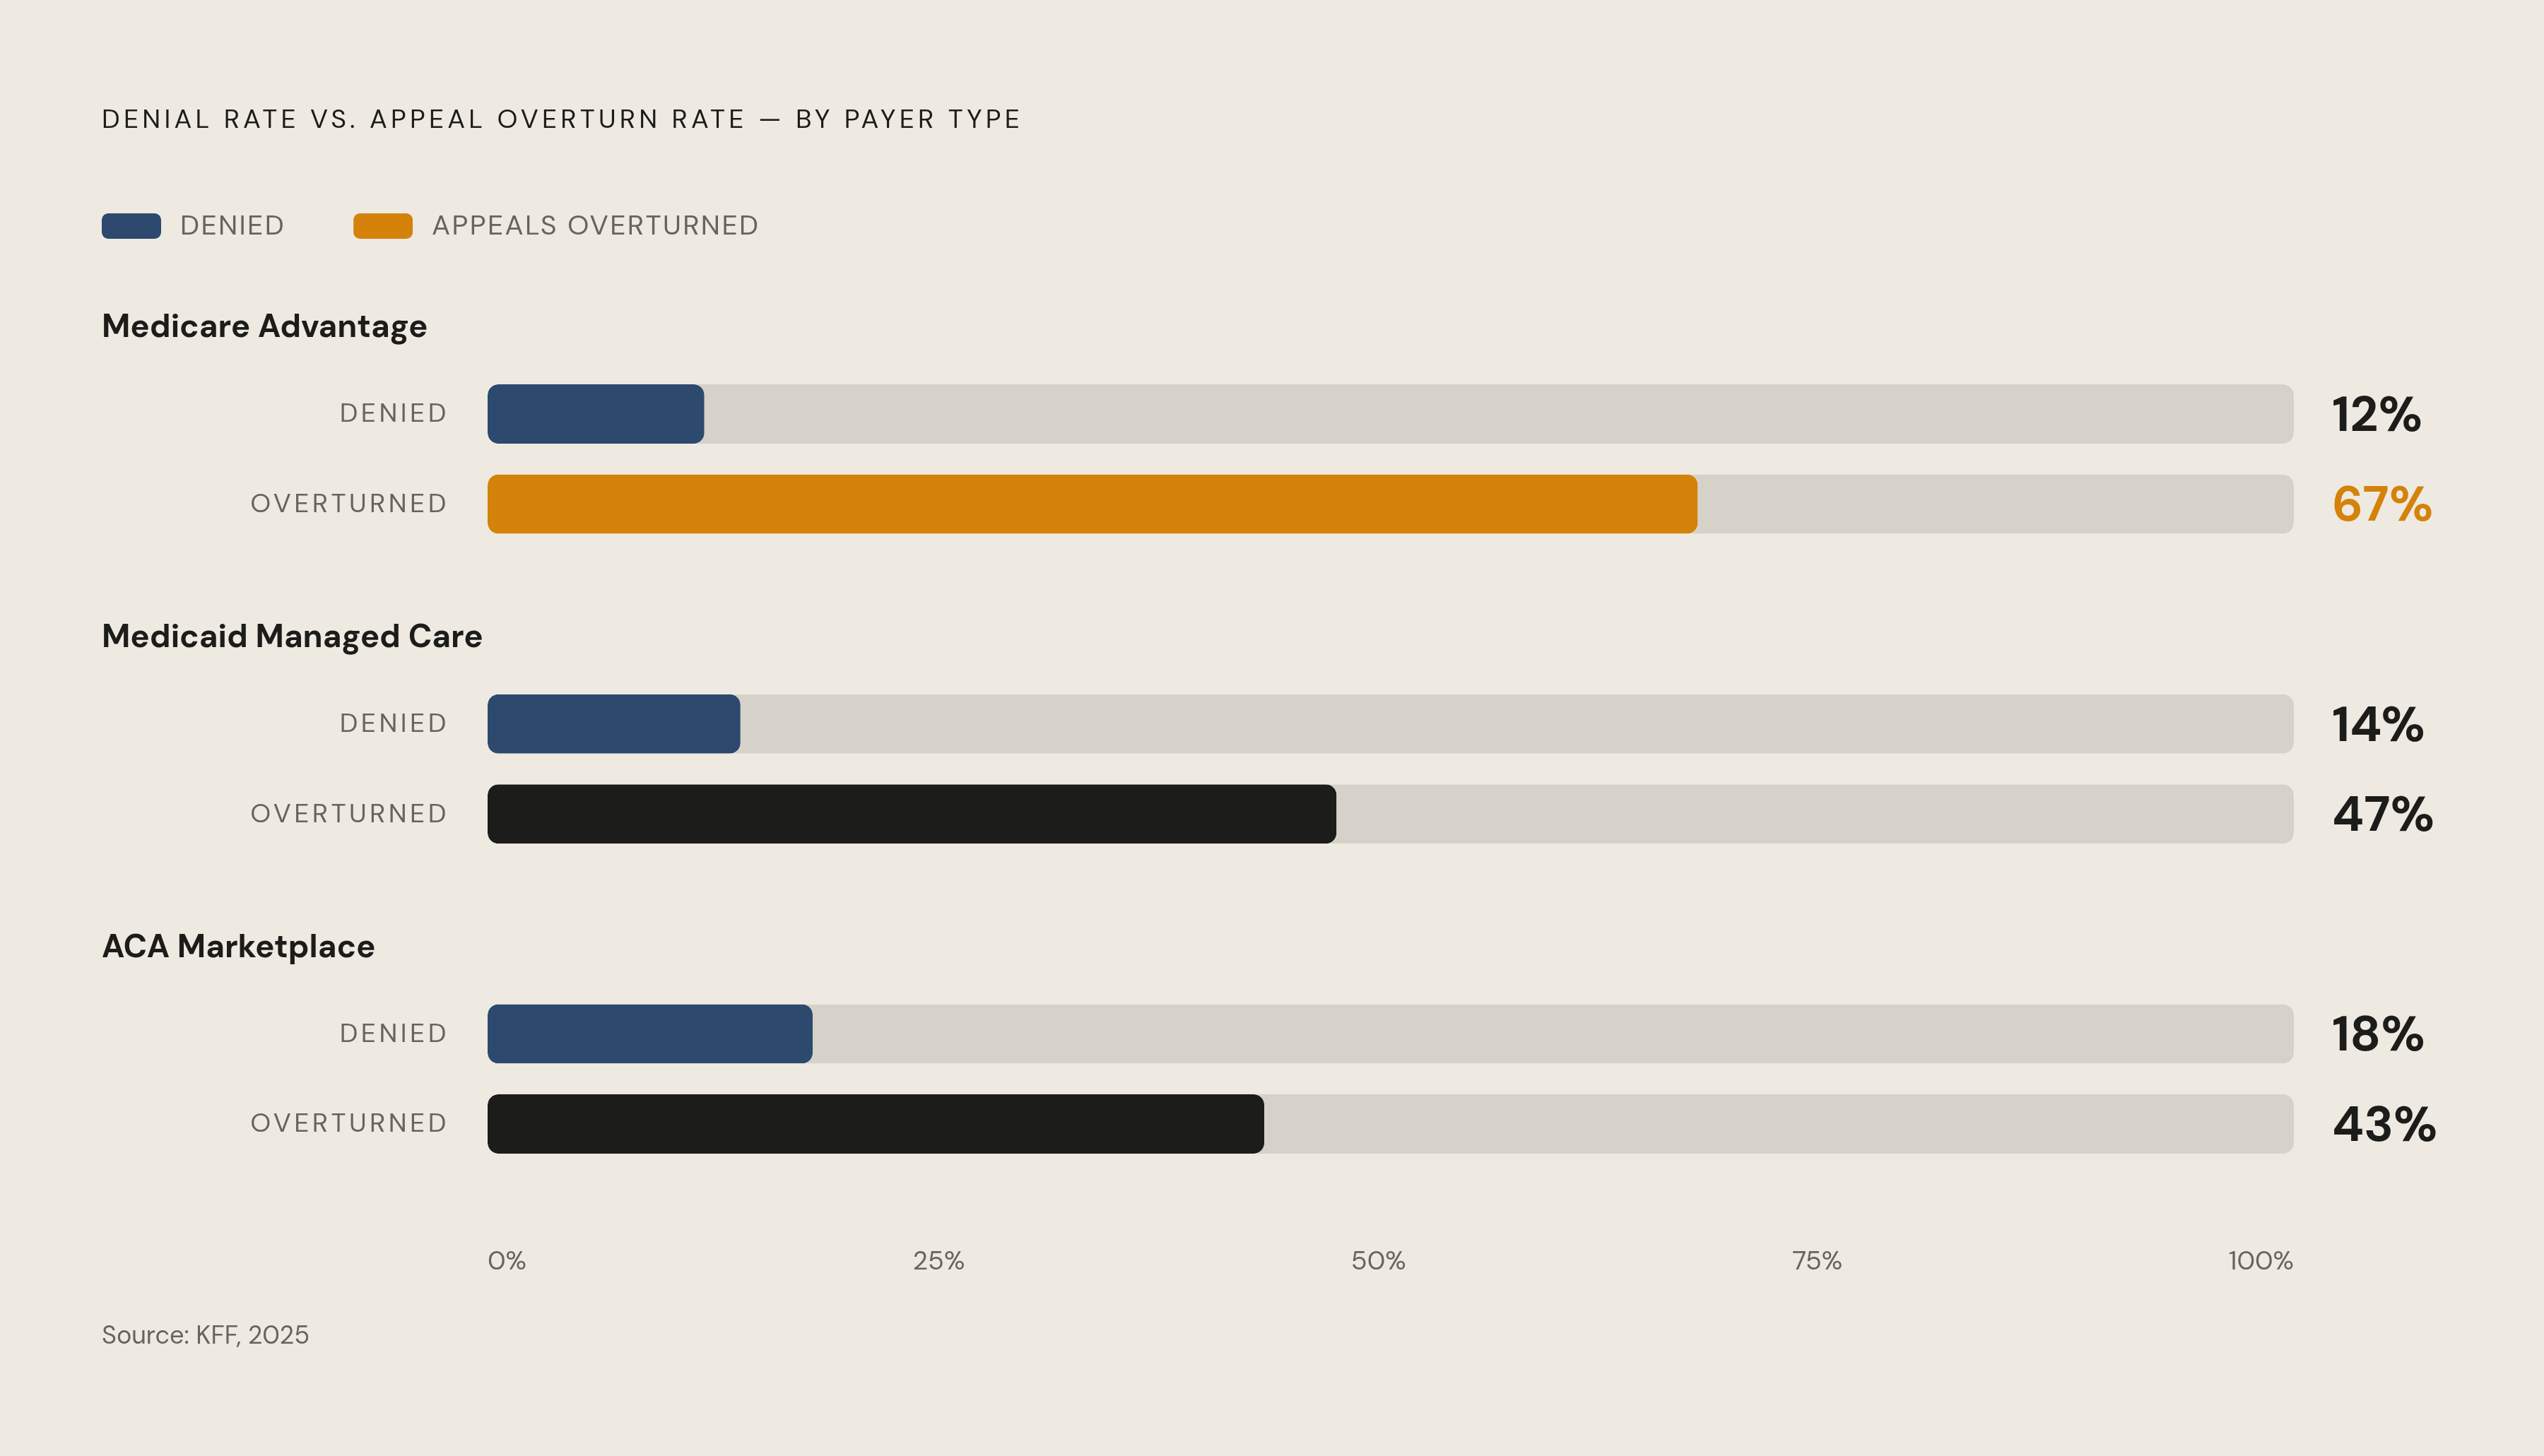
The denial numbers get worse outside Medicare Advantage, not better. KFF's 2025 analysis put Medicaid managed care denial rates at 14% and ACA Marketplace denial rates at 18%, both higher than the 12% MA figure. Across individual insurers in that dataset, the range ran from 2% to 25%, which means payer selection and panel composition drive a practice's denial exposure at least as much as its specialty does.
Appeal outcomes tell the more damning part of the story. Only a small fraction of denials get appealed at all, yet when they are, 67% of MA denials get overturned, alongside 47% in Medicaid managed care and 43% in ACA Marketplace plans. Those overturn rates are not neutral data; they are evidence that a large share of initial denials never had a solid clinical basis to begin with.
There is a darker trend inside this data. A Senate report found that skilled nursing facility stays got refused nine times more often after certain MA plans adopted AI review tools for utilization management. Automation on the payer side is not making prior authorization more accurate; it appears to be making over-denial more efficient.
The cost of managing all this falls on practices. According to the American Medical Association, practices and their staff spend an average of 13 hours per week on prior authorization requests. The clinical consequences are just as stark: in the AMA's 2024 survey, 94% of physicians said prior authorization negatively affects patient outcomes, and 23% said it led directly to a hospitalization.
The revenue math follows directly from the appeal data. A practice that does not appeal a denied prior authorization is giving up money it was clinically entitled to collect, because the 67% MA overturn rate says the denial was likely wrong in the first place. There is some movement on the payer side worth noting, with industry-level discussions around streamlining prior authorization processes underway. It remains a developing situation, not a settled outcome, and it will not eliminate denial management as an operational discipline any time soon.
The claim-level execution gap that determines whether the rate increase reaches the bank account
Industry benchmarks put a clean claim rate above 95% as the minimum acceptable target, with 98% or higher considered excellent. Below 90% signals systemic problems in how claims are built and submitted before they ever reach a payer.
Denials are expensive independent of whether they get overturned. Every denied claim costs somewhere in the range of $25 to $30 to rework, and adds 14 to 21 days to the payment cycle. Industry-wide denial rates in 2025 ran between 6% and 11% depending on specialty and payer mix, with initial denial rates reaching 11.8% in 2024 and projected at 12% to 15% in 2025. Experian Health's 2025 State of Claims survey found 41% of providers now report denial rates of 10% or higher.
Days in accounts receivable is the number that ties all of this together. Under 35 days is considered healthy; anything meaningfully above that threshold is a warning sign that real cash is sitting in claims nobody is actively working. A practice that captures the full 3.26% conversion factor increase but runs a 10% denial rate and 50-plus days in AR has not gained ground; it is treading water while payers hold onto its money.
The 2026 PFS adds new complexity on top of an already strained system: new codes, RVU recalibrations across categories, and an entirely new site-of-service PE methodology. Each of those is a fresh point of failure where a payer's system, still running last year's logic, mismatches against a correctly submitted 2026 claim. Rate changes are passive; they happen on a schedule and apply uniformly. Claim-level execution is active, and it is the only thing standing between the published conversion factor and what actually lands in a practice's bank account.
What practices need to have in place before January 1, 2026
Revenue modeling has to happen at the service-line level, not from the conversion factor headline. Separate procedure-heavy codes from E&M and time-based codes before projecting anything, since those two categories are moving in opposite directions under this rule.
Practices need to identify which of their services fall under the –2.5% efficiency adjustment and which are exempt, and flag any that also carry site-of-service PE changes on top of that. A hospital-based cardiology practice, for instance, is looking at both cuts stacking on the same procedure codes.
Office-based practices with chronic disease panels should evaluate APCM eligibility now and confirm all 13 required documentation elements are actually in place, not aspirational, before January 1. Waiting until the code is live to build the workflow means losing billable months.
Pulling payer-specific denial rates by CPT code and payer matters more than watching the industry average. The KFF range of 2% to 25% across individual plans means a practice's actual exposure depends on which plans make up its panel, not on what the national number says.
Practices need a process that tracks payer policy update dates separately from CMS effective dates. The lag between the two is precisely where a newly compliant, correctly coded claim still gets denied because the payer's system hasn't caught up yet.
Every denied prior authorization needs to be appealed, not triaged by dollar value and left to sit. A 67% MA overturn rate means most appealed denials succeed, and that revenue is recoverable for any practice willing to do the work of appealing it.
Claims monitoring needs to happen in real time, not at month-end. By the time a denial shows up on a monthly aging report, the oldest claims in that batch have already crossed the 90-day mark where collection probability starts falling.
For practices relying on a billing service or a technology platform to manage this, the standard worth holding that vendor to is straightforward: does it track payer policy updates as they publish, check claims against current payer policy before submission, and work every denial the moment it lands rather than queuing it by size. That distinction (a service that reacts to a monthly report versus one that closes the gap in real time) is what actually determines whether the 2026 rate increase shows up as collected revenue or stays theoretical.
Finally, every practice should confirm its current MIPS performance score against the 75-point threshold. That threshold holds through 2028, so any practice already above it can build a multi-year quality strategy without worrying about the target moving underneath it.